Explore the best ranked schools for the programs you are most interested in.
Davis Tech was not ranked in College Factual's Best Overall Colleges report this year. This may be because not enough data was available.
Returning adults and other non-traditional students may appreciate the fact that Davis Technical College has an open admissions policy. This means that you'll only have to submit basic materials, which may include proof that you completed high school or an equivalent program.
At Davis Tech, the student to faculty ratio is an excellent 9 to 1. That's much better than the national average of 15 to 1. This indicates that many classes will probably be small, and students will have ample opportunites to work closely with their professors and classmates.
The freshmen retention rate tells us what percentage of first-year, full-time students choose to continue on to their sophomore year at a particular school. The rate at Davis Technical College is 70%, which is about average when compared to the national rate of 68%.
During the 2017-2018 academic year, there were 3,814 undergraduates at Davis Tech with 368 being full-time and 3,446 being part-time.
The net price is calculated by adding tuition, room, board and other costs and subtracting financial aid.Note that the net price is typically less than the published for a school. For more information on the sticker price of Davis Tech, see our tuition and fees and room and board pages.
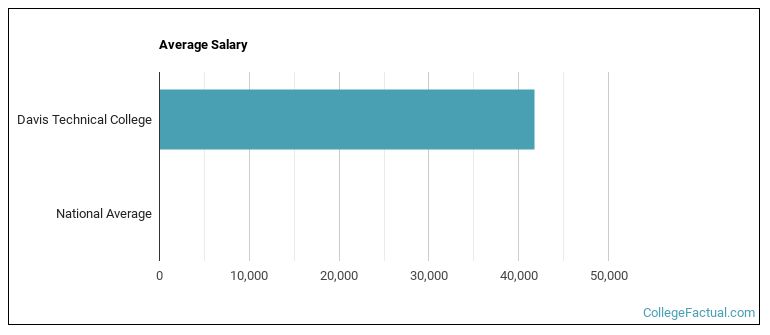
See which majors at Davis Technical College make the most money.
Get more details about the location of Davis Technical College.

Contact details for Davis Tech are given below.
| Contact Details | |
|---|---|
| Address: | 550 E 300 S, Kaysville, UT 84037-2699 |
| Phone: | 801-593-2500 |
| Website: | https://www.davistech.edu/ |
| Most Popular Majors | Bachelor’s Degrees | Average Salary of Graduates |
|---|---|---|
| Practical Nursing & Nursing Assistants | 354 | NA |
| Cosmetology | 231 | NA |
| Allied Health & Medical Assisting Services | 170 | NA |
| Clinical/Medical Laboratory Science | 90 | NA |
| Vehicle Maintenance & Repair | 68 | NA |
| Computer Information Systems | 64 | NA |
| Precision Metal Working | 56 | NA |
| Industrial Production Technology | 52 | NA |
| Business Support & Assistant Services | 51 | NA |
| Allied Health Professions | 51 | NA |
Footnotes
*The racial-ethnic minorities count is calculated by taking the total number of students and subtracting white students, international students, and students whose race/ethnicity was unknown. This number is then divided by the total number of students at the school to obtain the racial-ethnic minorities percentage.
References
More about our data sources and methodologies.