DePaul total enrollment is approximately 21,922 students. 12,776 are undergraduates and 5,436 are graduate students.
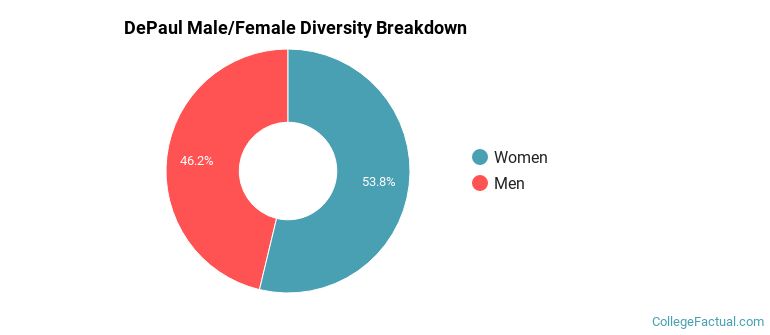
Male/Female Breakdown of Undergraduates
The full-time DePaul undergraduate population is made up of 54% women, and 46% men.

For the gender breakdown for all students, go here.
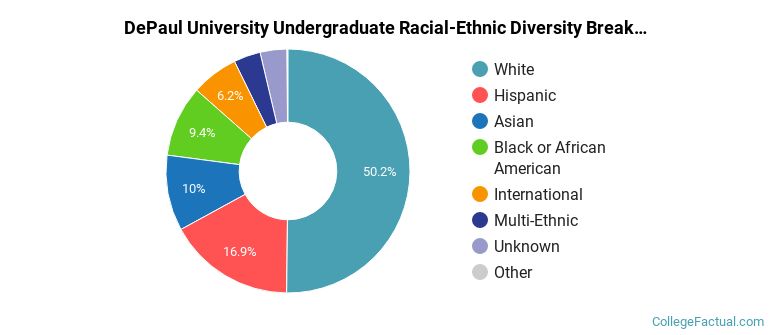
DePaul Racial/Ethnic Breakdown of Undergraduates

| Race/Ethnicity | Number |
|---|---|
| White | 6,563 |
| Hispanic | 2,646 |
| Asian | 1,495 |
| Black or African American | 913 |
| Multi-Ethnic | 595 |
| International | 328 |
| Unknown | 199 |
| Native Hawaiian or Pacific Islander | 19 |
See racial/ethnic breakdown for all students.
Male/Female Breakdown of Graduate Students
About 57% of full-time grad students are women, and 43% men.

For the gender breakdown for all students, go here.
DePaul Racial-Ethnic Breakdown of Graduate Students

| Race/Ethnicity | Number |
|---|---|
| White | 2,516 |
| Hispanic | 720 |
| Black or African American | 687 |
| International | 667 |
| Asian | 486 |
| Unknown | 215 |
| Multi-Ethnic | 133 |
| Native Hawaiian or Pacific Islander | 5 |
See racial/ethnic breakdown for all students.
| Race/Ethnicity | Number |
|---|---|
| White | 10,808 |
| Hispanic | 3,974 |
| Asian | 2,331 |
| Black or African American | 2,172 |
| International | 1,114 |
| Multi-Ethnic | 830 |
| Unknown | 629 |
| Native Hawaiian or Pacific Islander | 30 |
There are approximately 11,896 female students and 10,026 male students at DePaul.
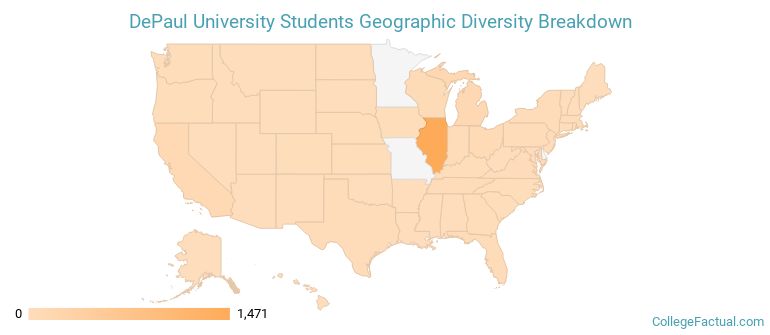
DePaul ranks 272 out of 2,183 when it comes to geographic diversity.
39.99% of DePaul students come from out of state, and 0.16% come from out of the country.
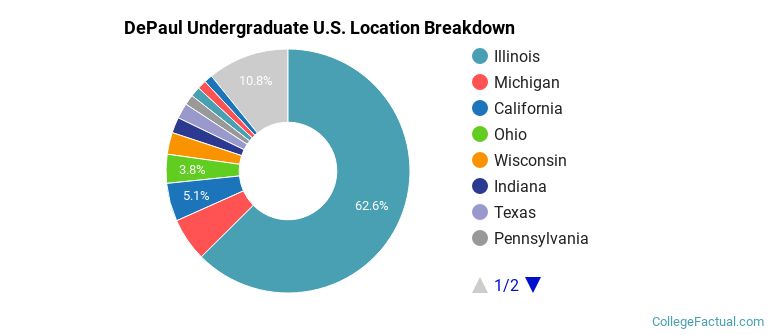
The undergraduate student body is split among 44 states (may include Washington D.C.). Click on the map for more detail.
| State | Amount |
|---|---|
| Illinois | 1,471 |
| Michigan | 135 |
| California | 119 |
| Ohio | 90 |
| Wisconsin | 68 |
Students from 111 countries are represented at this school, with the majority of the international students coming from China, India, and Saudi Arabia.
Learn more about international students at DePaul.
A traditional college student is defined as being between the ages of 18-21. At DePaul, 42.53% of students fall into that category, compared to the national average of 60%.
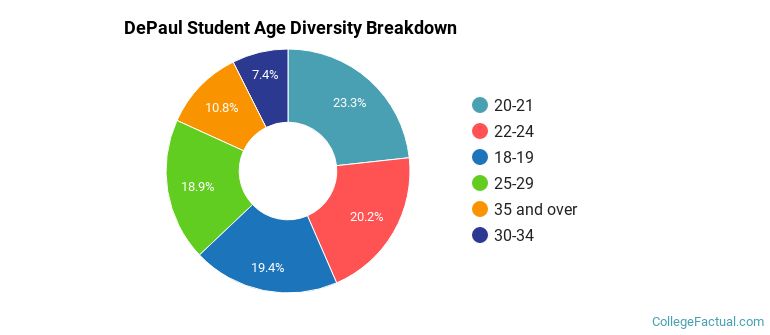
| Student Age Group | Amount |
|---|---|
| 20-21 | 5,274 |
| 22-24 | 4,582 |
| 18-19 | 4,409 |
| 25-29 | 4,279 |
| 35 and over | 2,445 |
| 30-34 | 1,683 |
| Under 18 | 0 |
Footnotes
*The racial-ethnic minorities count is calculated by taking the total number of students and subtracting white students, international students, and students whose race/ethnicity was unknown. This number is then divided by the total number of students at the school to obtain the racial-ethnic minorities percentage.
References
Department of Homeland Security Citizenship and Immigration Services
Find out how College Factual created their Diversity Rankings.