Dominican College total enrollment is approximately 1,724 students. 1,222 are undergraduates and 205 are graduate students.
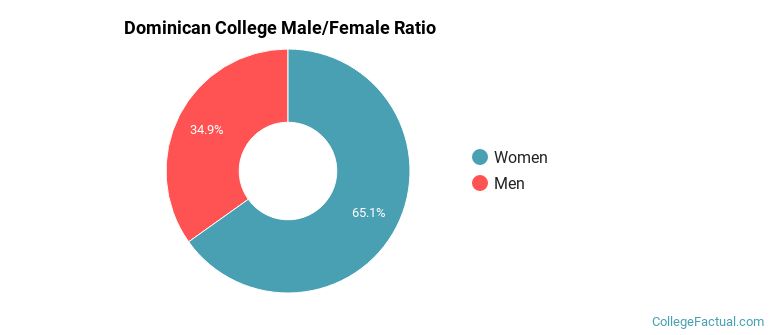
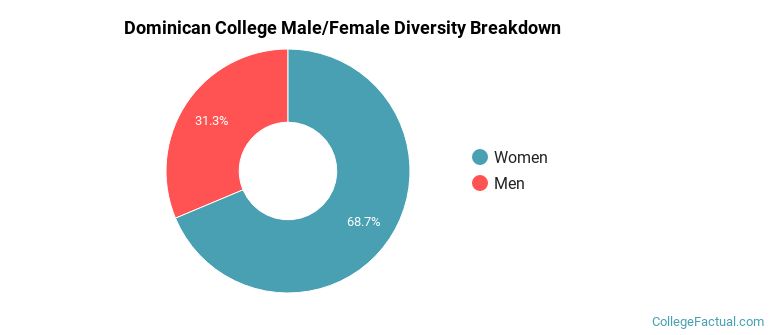
Male/Female Breakdown of Undergraduates
The full-time Dominican College undergraduate population is made up of 66% women, and 34% men.
For the gender breakdown for all students, go here.
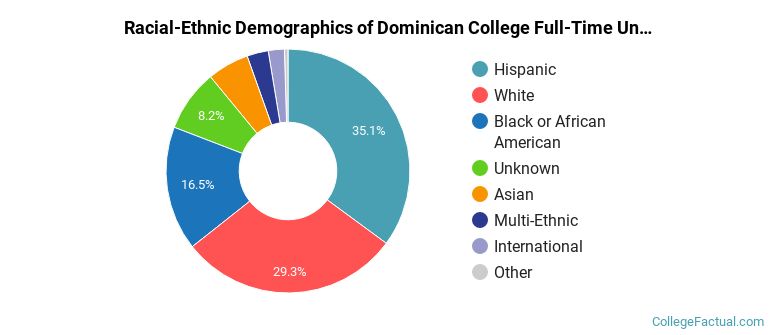
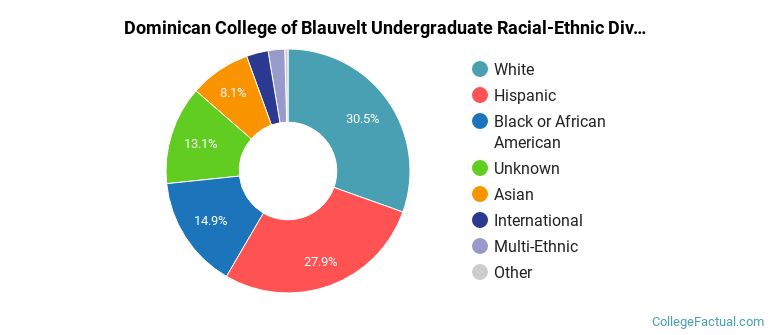
Dominican College Racial/Ethnic Breakdown of Undergraduates
| Race/Ethnicity | Number |
|---|---|
| Hispanic | 457 |
| White | 313 |
| Black or African American | 208 |
| Unknown | 102 |
| Asian | 76 |
| International | 34 |
| Multi-Ethnic | 26 |
| Native Hawaiian or Pacific Islander | 6 |
See racial/ethnic breakdown for all students.
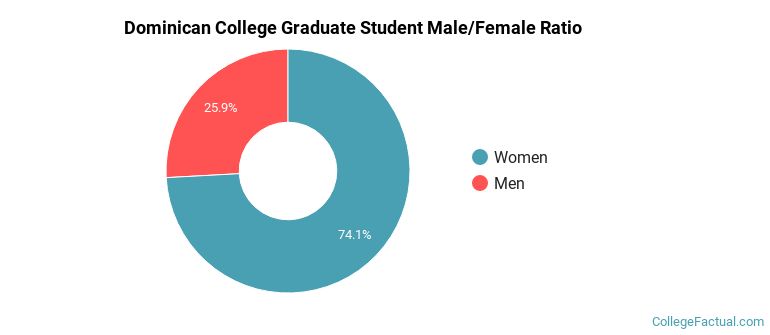
Male/Female Breakdown of Graduate Students
About 74% of full-time grad students are women, and 26% men.
For the gender breakdown for all students, go here.
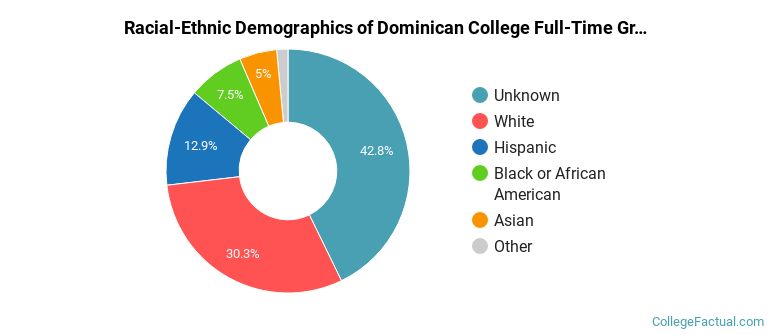
Dominican College Racial-Ethnic Breakdown of Graduate Students
| Race/Ethnicity | Number |
|---|---|
| Unknown | 84 |
| White | 62 |
| Hispanic | 20 |
| Black or African American | 14 |
| Asian | 13 |
| International | 8 |
| Native Hawaiian or Pacific Islander | 2 |
| Multi-Ethnic | 2 |
See racial/ethnic breakdown for all students.
| Race/Ethnicity | Number |
|---|---|
| Hispanic | 508 |
| White | 486 |
| Black or African American | 276 |
| Unknown | 225 |
| Asian | 134 |
| International | 54 |
| Multi-Ethnic | 32 |
| Native Hawaiian or Pacific Islander | 9 |
There are approximately 1,180 female students and 544 male students at Dominican College.
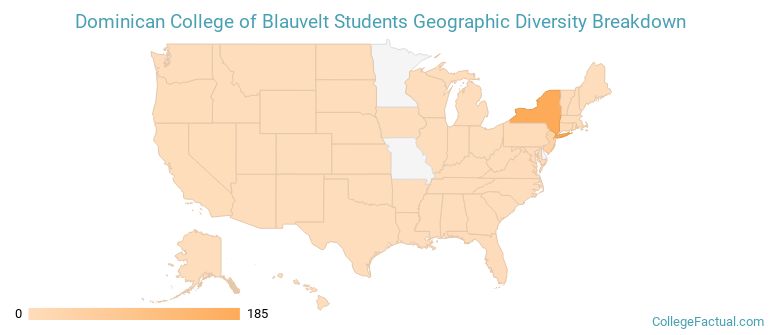
Dominican College ranks 1,226 out of 2,183 when it comes to geographic diversity.
26.09% of Dominican College students come from out of state, and 0% come from out of the country.
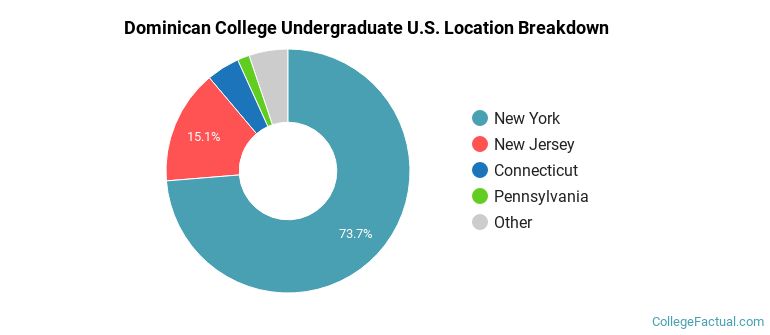
The undergraduate student body is split among 13 states (may include Washington D.C.). Click on the map for more detail.
| State | Amount |
|---|---|
| New York | 185 |
| New Jersey | 38 |
| Connecticut | 11 |
| Pennsylvania | 4 |
| Florida | 2 |
Students from 17 countries are represented at this school, with the majority of the international students coming from Canada, Mexico, and Spain.
Learn more about international students at Dominican College.
A traditional college student is defined as being between the ages of 18-21. At Dominican College, 40.69% of students fall into that category, compared to the national average of 60%.
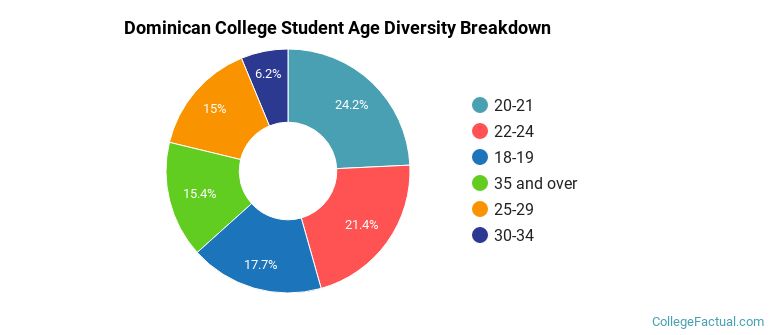
| Student Age Group | Amount |
|---|---|
| 20-21 | 459 |
| 22-24 | 405 |
| 18-19 | 336 |
| 35 and over | 292 |
| 25-29 | 284 |
| 30-34 | 118 |
| Under 18 | 0 |
Footnotes
*The racial-ethnic minorities count is calculated by taking the total number of students and subtracting white students, international students, and students whose race/ethnicity was unknown. This number is then divided by the total number of students at the school to obtain the racial-ethnic minorities percentage.
References
Department of Homeland Security Citizenship and Immigration Services
Find out how College Factual created their Diversity Rankings.