Dordt total enrollment is approximately 1,662 students. 1,339 are undergraduates and 6 are graduate students.
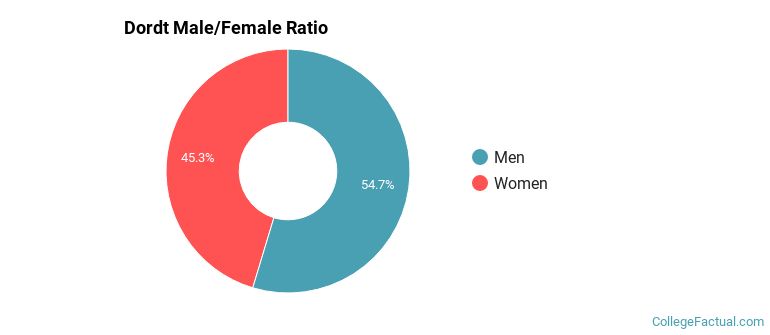
Male/Female Breakdown of Undergraduates
The full-time Dordt undergraduate population is made up of 46% women, and 54% men.
For the gender breakdown for all students, go here.
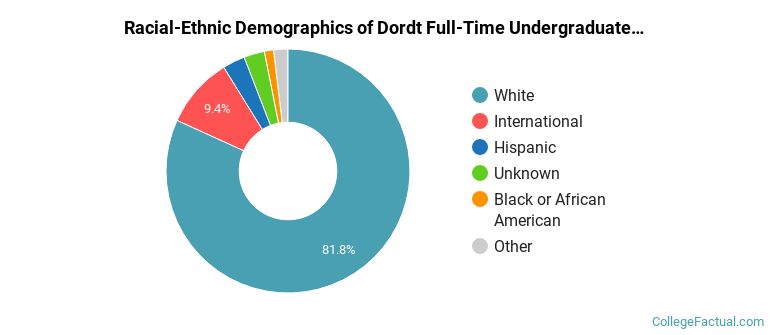
Dordt Racial/Ethnic Breakdown of Undergraduates
| Race/Ethnicity | Number |
|---|---|
| White | 1,109 |
| International | 108 |
| Hispanic | 41 |
| Unknown | 35 |
| Multi-Ethnic | 19 |
| Asian | 15 |
| Black or African American | 7 |
| Native Hawaiian or Pacific Islander | 0 |
See racial/ethnic breakdown for all students.
Male/Female Breakdown of Graduate Students
About 17% of full-time grad students are women, and 83% men.

For the gender breakdown for all students, go here.
Dordt Racial-Ethnic Breakdown of Graduate Students

| Race/Ethnicity | Number |
|---|---|
| White | 6 |
| Asian | 0 |
| Black or African American | 0 |
| Hispanic | 0 |
| Native Hawaiian or Pacific Islander | 0 |
| International | 0 |
| Multi-Ethnic | 0 |
| Unknown | 0 |
See racial/ethnic breakdown for all students.
| Race/Ethnicity | Number |
|---|---|
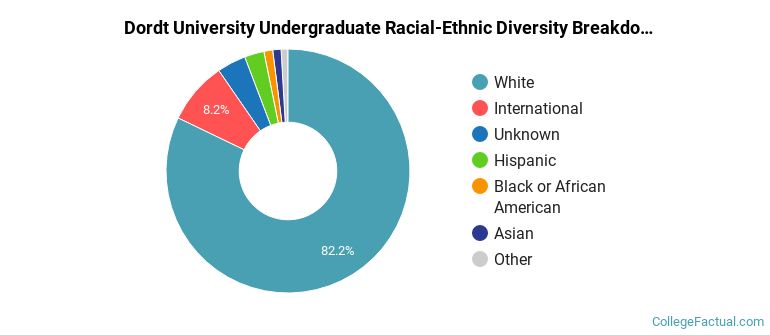
| White | 1,349 |
| International | 119 |
| Unknown | 89 |
| Hispanic | 43 |
| Asian | 25 |
| Multi-Ethnic | 20 |
| Black or African American | 12 |
| Native Hawaiian or Pacific Islander | 0 |
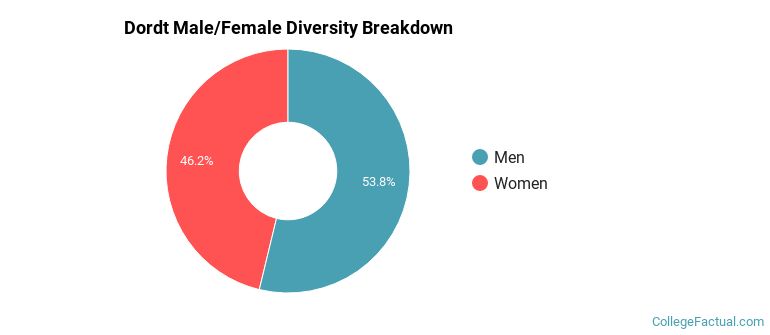
There are approximately 816 female students and 846 male students at Dordt.
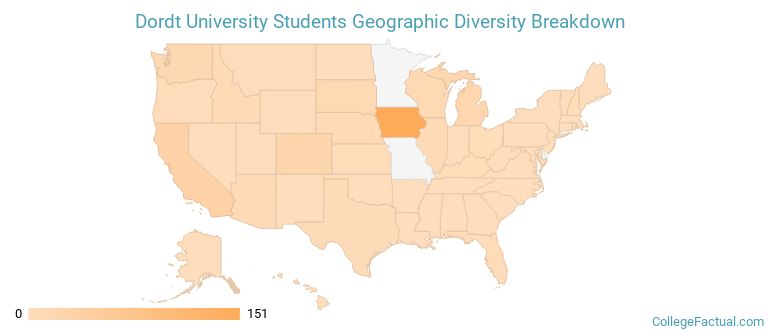
Dordt ranks 376 out of 2,183 when it comes to geographic diversity.
58.06% of Dordt students come from out of state, and 8.16% come from out of the country.
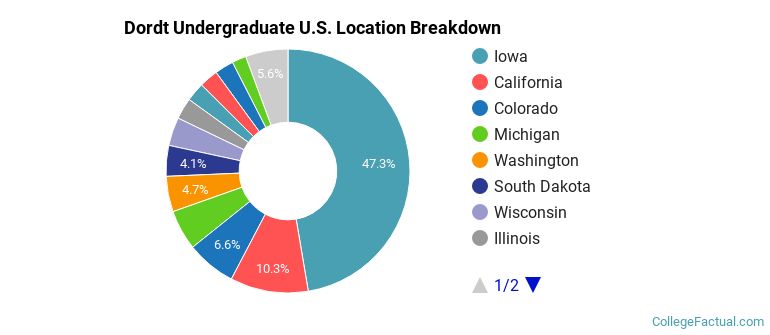
The undergraduate student body is split among 23 states (may include Washington D.C.). Click on the map for more detail.
| State | Amount |
|---|---|
| Iowa | 151 |
| California | 33 |
| Colorado | 21 |
| Michigan | 17 |
| Washington | 15 |
Students from 29 countries are represented at this school, with the majority of the international students coming from Canada, South Korea, and Indonesia.
Learn more about international students at Dordt.
A traditional college student is defined as being between the ages of 18-21. At Dordt, 64.32% of students fall into that category, compared to the national average of 60%.
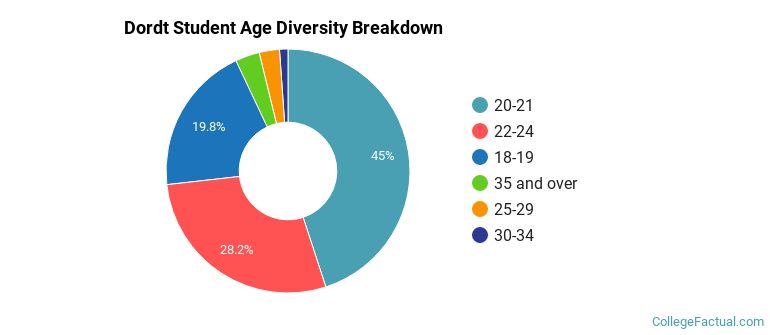
| Student Age Group | Amount |
|---|---|
| 20-21 | 685 |
| 22-24 | 430 |
| 18-19 | 301 |
| 35 and over | 49 |
| 25-29 | 41 |
| 30-34 | 17 |
| Under 18 | 0 |
Footnotes
*The racial-ethnic minorities count is calculated by taking the total number of students and subtracting white students, international students, and students whose race/ethnicity was unknown. This number is then divided by the total number of students at the school to obtain the racial-ethnic minorities percentage.
References