Go directly to any of the following sections:
The bachelor's program at Drexel was ranked #112 on College Factual's Best Schools for parks & rec list. It is also ranked #3 in Pennsylvania.
During the 2021-2022 academic year, Drexel University handed out 31 bachelor's degrees in parks, recreation, leisure, & fitness studies. This is an increase of 29% over the previous year when 24 degrees were handed out.
In 2022, 13 students received their master’s degree in parks & rec from Drexel. This makes it the #211 most popular school for parks & rec master’s degree candidates in the country.
Part-time undergraduates at Drexel paid an average of $1,311 per credit hour in 2022-2023. This tuition was the same for both in-state and out-of-state students. The average full-time tuition and fees for undergraduates are shown in the table below.
| In State | Out of State | |
|---|---|---|
| Tuition | $58,293 | $58,293 |
| Fees | $2,370 | $2,370 |
| Books and Supplies | $1,700 | $1,700 |
| On Campus Room and Board | $17,550 | $17,550 |
| On Campus Other Expenses | $1,500 | $1,500 |
Learn more about Drexel tuition and fees.
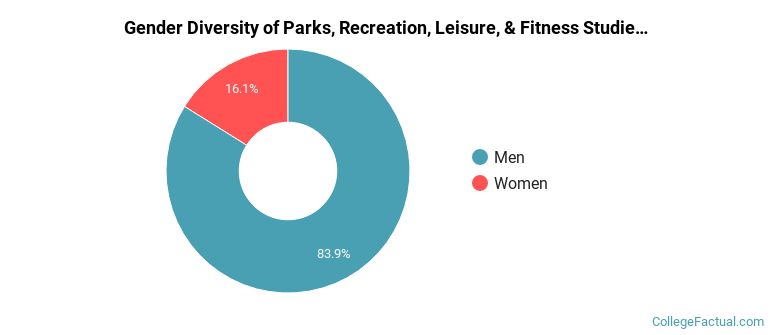
The parks & rec program at Drexel awarded 31 bachelor's degrees in 2021-2022. About 84% of these degrees went to men with the other 16% going to women.
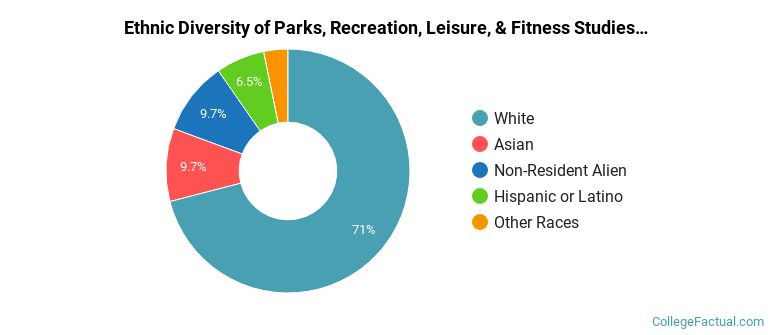
The majority of the students with this major are white. About 71% of 2022 graduates were in this category.
The following table and chart show the ethnic background for students who recently graduated from Drexel University with a bachelor's in parks & rec.
| Ethnic Background | Number of Students |
|---|---|
| Asian | 3 |
| Black or African American | 0 |
| Hispanic or Latino | 2 |
| White | 22 |
| Non-Resident Aliens | 3 |
| Other Races | 1 |
Drexel does not offer an online option for its parks & rec bachelor’s degree program at this time. To see if the school offers distance learning options in other areas, visit the Drexel Online Learning page.
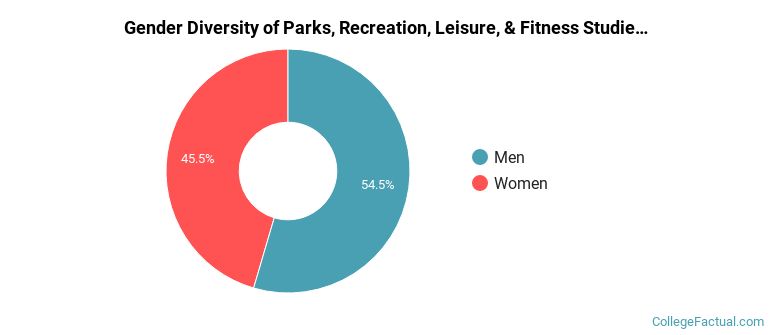
Of the 11 students who earned a master's degree in Parks, Recreation, Leisure, & Fitness Studies from Drexel in 2021-2022, 55% were men and 45% were women.
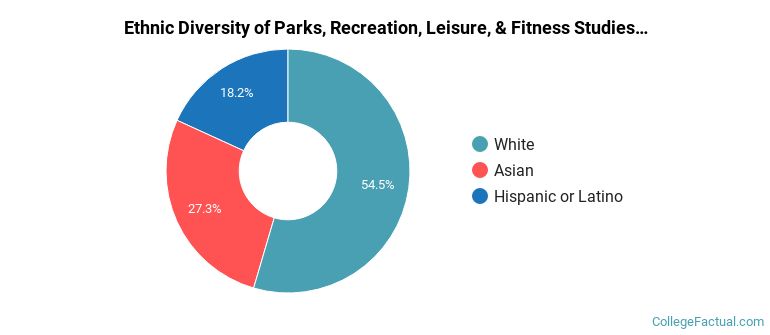
The majority of the students with this major are white. About 55% of 2022 graduates were in this category.
The following table and chart show the ethnic background for students who recently graduated from Drexel University with a master's in parks & rec.
| Ethnic Background | Number of Students |
|---|---|
| Asian | 3 |
| Black or African American | 0 |
| Hispanic or Latino | 2 |
| White | 6 |
| Non-Resident Aliens | 0 |
| Other Races | 0 |
Take a look at the following statistics related to the make-up of the parks & rec majors at Drexel University.
Parks, Recreation, Leisure, & Fitness Studies students may decide to major in one of the following focus areas. Individual majors may not be available for all degree levels.
| Major | Annual Graduates |
|---|---|
| Health & Physical Education | 44 |
| Related Major | Annual Graduates |
|---|---|
| Public Administration & Social Service | 12 |
View All Parks, Recreation, Leisure, & Fitness Studies Related Majors >
More about our data sources and methodologies.