Drexel total enrollment is approximately 23,589 students. 13,156 are undergraduates and 4,333 are graduate students.
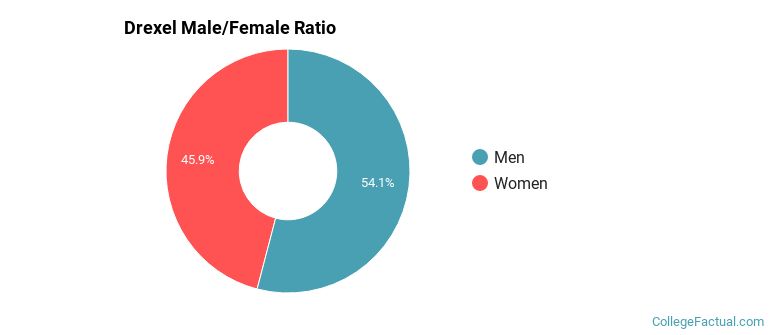
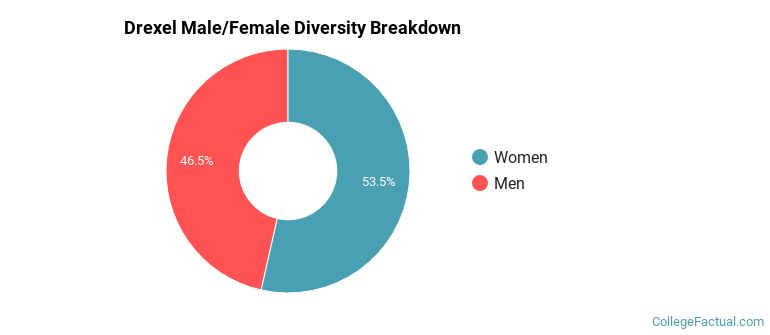
Male/Female Breakdown of Undergraduates
The full-time Drexel undergraduate population is made up of 47% women, and 53% men.
For the gender breakdown for all students, go here.
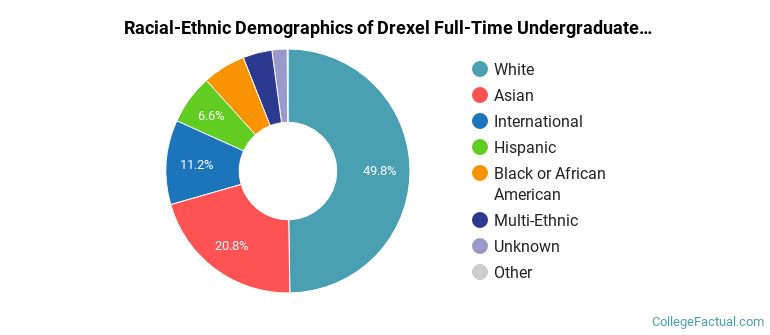
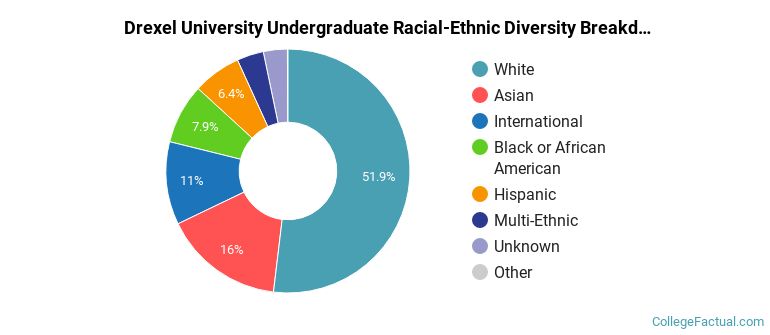
Drexel Racial/Ethnic Breakdown of Undergraduates
| Race/Ethnicity | Number |
|---|---|
| White | 6,388 |
| Asian | 2,980 |
| International | 1,255 |
| Hispanic | 909 |
| Black or African American | 792 |
| Multi-Ethnic | 520 |
| Unknown | 298 |
| Native Hawaiian or Pacific Islander | 6 |
See racial/ethnic breakdown for all students.
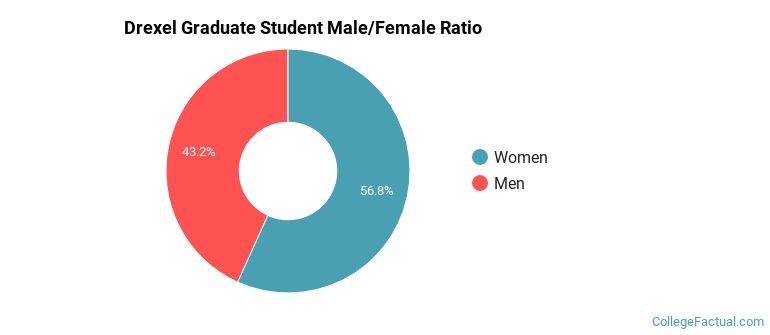
Male/Female Breakdown of Graduate Students
About 58% of full-time grad students are women, and 42% men.
For the gender breakdown for all students, go here.
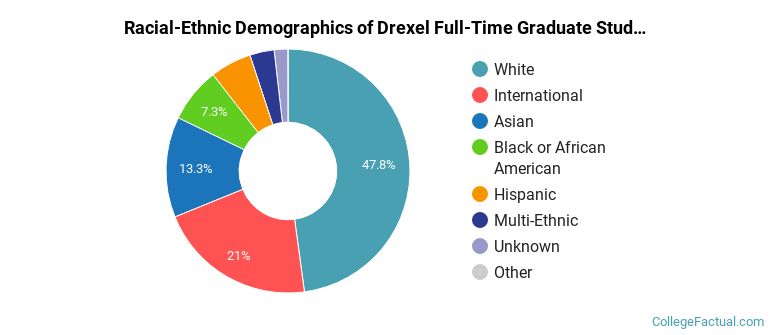
Drexel Racial-Ethnic Breakdown of Graduate Students
| Race/Ethnicity | Number |
|---|---|
| White | 2,102 |
| International | 726 |
| Asian | 618 |
| Black or African American | 338 |
| Hispanic | 287 |
| Multi-Ethnic | 170 |
| Unknown | 88 |
| Native Hawaiian or Pacific Islander | 1 |
See racial/ethnic breakdown for all students.
| Race/Ethnicity | Number |
|---|---|
| White | 12,100 |
| Asian | 4,045 |
| International | 2,214 |
| Black or African American | 1,959 |
| Hispanic | 1,619 |
| Multi-Ethnic | 880 |
| Unknown | 745 |
| Native Hawaiian or Pacific Islander | 10 |
There are approximately 12,831 female students and 10,758 male students at Drexel.
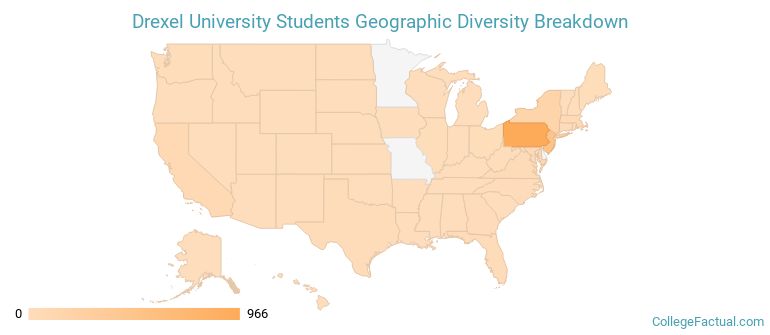
Drexel ranks 268 out of 2,183 when it comes to geographic diversity.
53.29% of Drexel students come from out of state, and 8.51% come from out of the country.
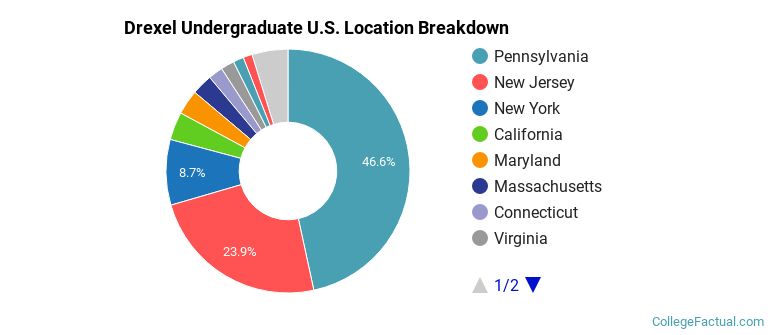
The undergraduate student body is split among 37 states (may include Washington D.C.). Click on the map for more detail.
| State | Amount |
|---|---|
| Pennsylvania | 966 |
| New Jersey | 495 |
| New York | 180 |
| California | 77 |
| Maryland | 68 |
Students from 127 countries are represented at this school, with the majority of the international students coming from China, India, and Vietnam.
Learn more about international students at Drexel.
A traditional college student is defined as being between the ages of 18-21. At Drexel, 40.97% of students fall into that category, compared to the national average of 60%.
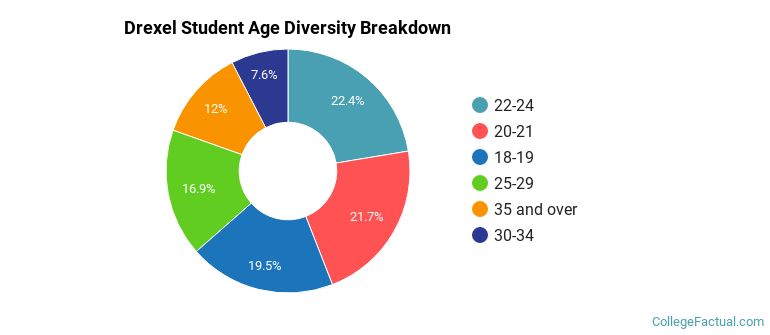
| Student Age Group | Amount |
|---|---|
| 22-24 | 5,395 |
| 20-21 | 5,221 |
| 18-19 | 4,690 |
| 25-29 | 4,072 |
| 35 and over | 2,887 |
| 30-34 | 1,829 |
| Under 18 | 0 |
Footnotes
*The racial-ethnic minorities count is calculated by taking the total number of students and subtracting white students, international students, and students whose race/ethnicity was unknown. This number is then divided by the total number of students at the school to obtain the racial-ethnic minorities percentage.
References
Department of Homeland Security Citizenship and Immigration Services
Read College Factual's Diversity Ranking Methodology.