Duke total enrollment is approximately 16,172 students. 6,572 are undergraduates and 8,780 are graduate students.
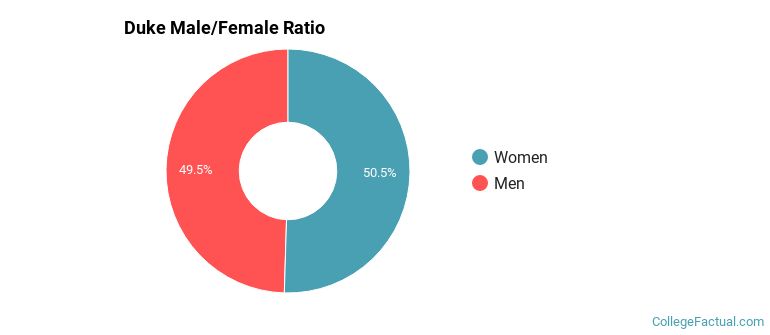
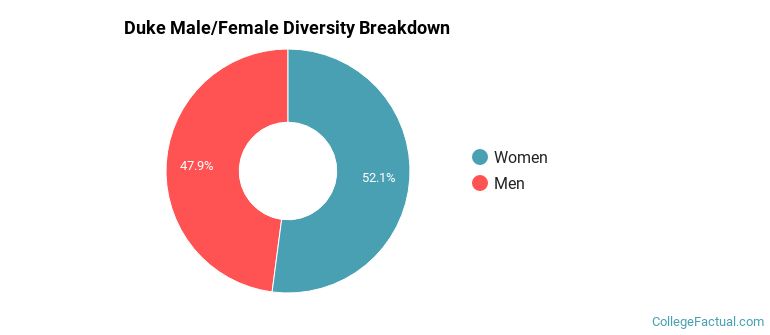
Male/Female Breakdown of Undergraduates
The full-time Duke undergraduate population is made up of 51% women, and 49% men.
For the gender breakdown for all students, go here.
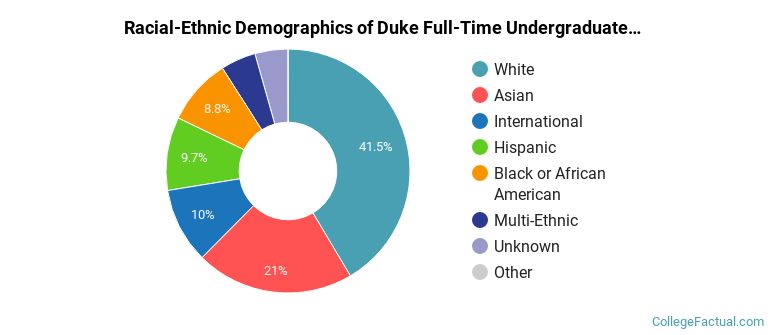
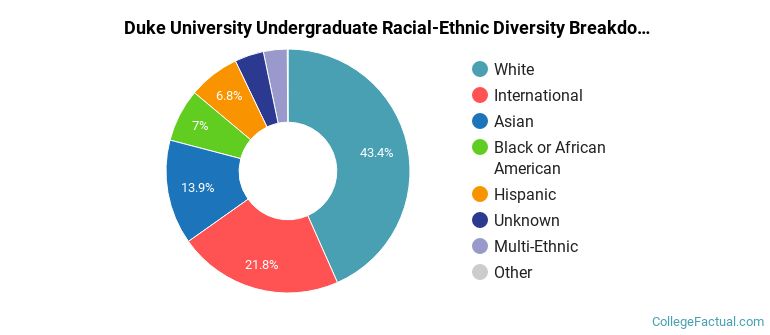
Duke Racial/Ethnic Breakdown of Undergraduates
| Race/Ethnicity | Number |
|---|---|
| White | 2,661 |
| Asian | 1,397 |
| Hispanic | 669 |
| Black or African American | 576 |
| International | 527 |
| Multi-Ethnic | 380 |
| Unknown | 325 |
| Native Hawaiian or Pacific Islander | 3 |
See racial/ethnic breakdown for all students.
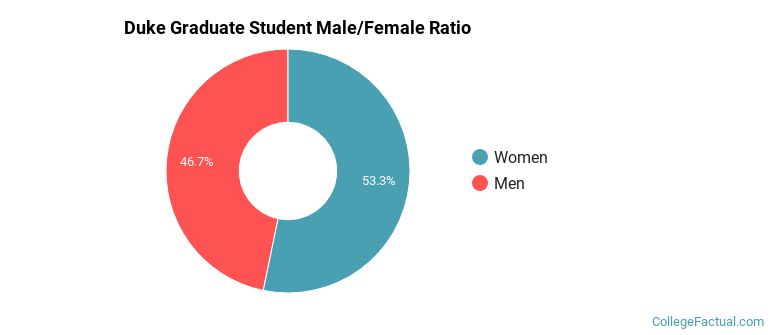
Male/Female Breakdown of Graduate Students
About 53% of full-time grad students are women, and 47% men.
For the gender breakdown for all students, go here.
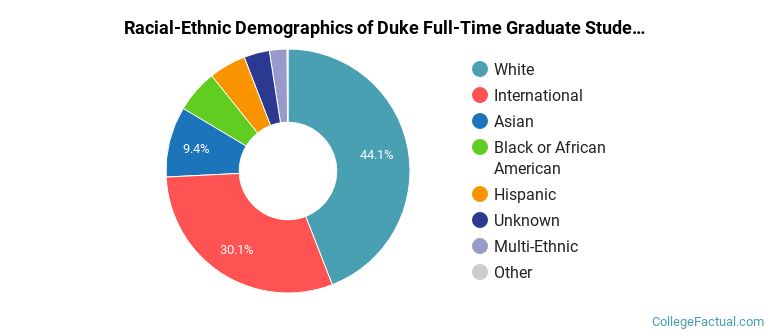
Duke Racial-Ethnic Breakdown of Graduate Students
| Race/Ethnicity | Number |
|---|---|
| White | 4,055 |
| International | 2,258 |
| Asian | 806 |
| Black or African American | 551 |
| Hispanic | 506 |
| Unknown | 304 |
| Multi-Ethnic | 273 |
| Native Hawaiian or Pacific Islander | 7 |
See racial/ethnic breakdown for all students.
| Race/Ethnicity | Number |
|---|---|
| White | 7,106 |
| International | 2,954 |
| Asian | 2,284 |
| Hispanic | 1,211 |
| Black or African American | 1,175 |
| Unknown | 692 |
| Multi-Ethnic | 685 |
| Native Hawaiian or Pacific Islander | 10 |
There are approximately 8,515 female students and 7,657 male students at Duke.
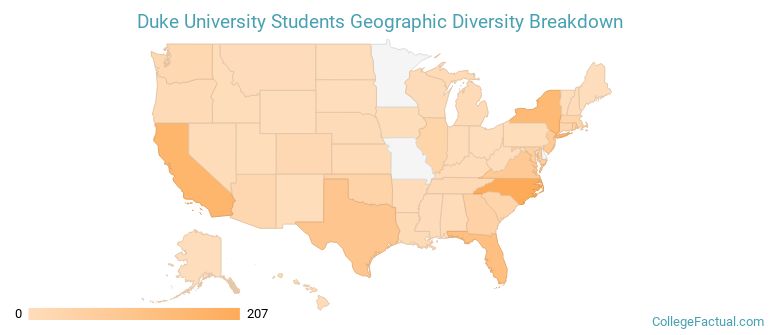
Duke ranks 25 out of 2,183 when it comes to geographic diversity.
83.53% of Duke students come from out of state, and 9.63% come from out of the country.
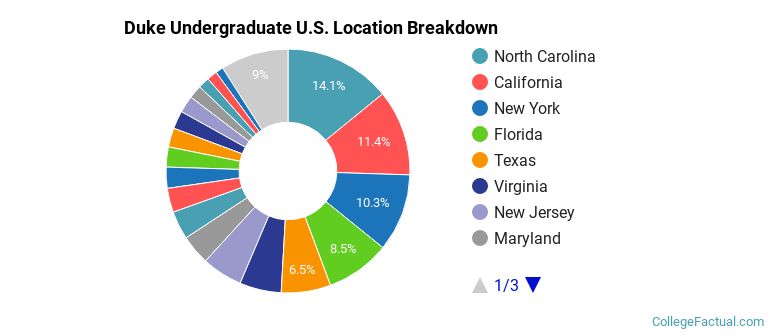
The undergraduate student body is split among 46 states (may include Washington D.C.). Click on the map for more detail.
| State | Amount |
|---|---|
| North Carolina | 207 |
| California | 167 |
| New York | 151 |
| Florida | 125 |
| Texas | 96 |
Students from 126 countries are represented at this school, with the majority of the international students coming from China, India, and South Korea.
Learn more about international students at Duke.
A traditional college student is defined as being between the ages of 18-21. At Duke, 39.15% of students fall into that category, compared to the national average of 60%.
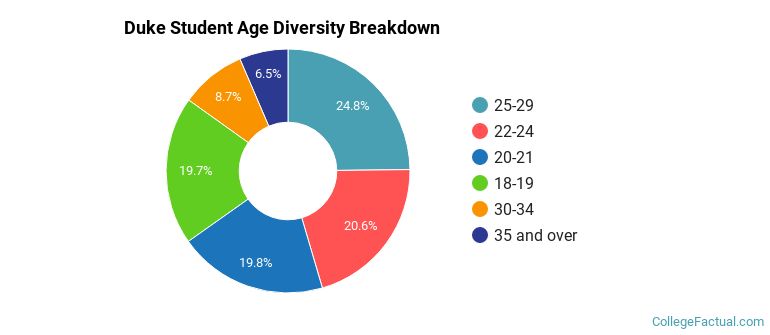
| Student Age Group | Amount |
|---|---|
| 25-29 | 3,975 |
| 22-24 | 3,305 |
| 20-21 | 3,165 |
| 18-19 | 3,150 |
| 30-34 | 1,389 |
| 35 and over | 1,034 |
| Under 18 | 0 |
Footnotes
*The racial-ethnic minorities count is calculated by taking the total number of students and subtracting white students, international students, and students whose race/ethnicity was unknown. This number is then divided by the total number of students at the school to obtain the racial-ethnic minorities percentage.
References
Department of Homeland Security Citizenship and Immigration Services
Image Credit: By Bjoertvedt under License