Duquesne total enrollment is approximately 8,830 students. 5,292 are undergraduates and 3,069 are graduate students.
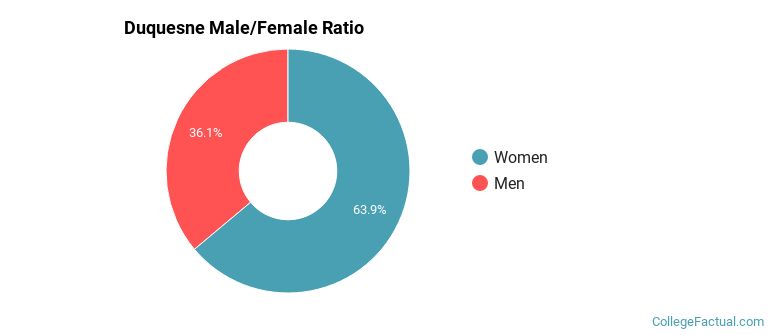
Male/Female Breakdown of Undergraduates
The full-time Duquesne undergraduate population is made up of 65% women, and 35% men.
For the gender breakdown for all students, go here.
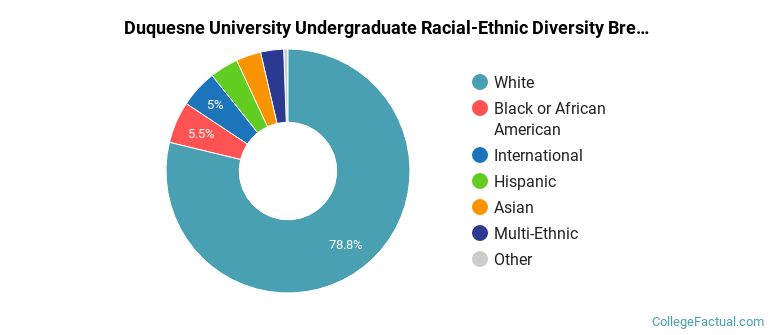
Duquesne Racial/Ethnic Breakdown of Undergraduates
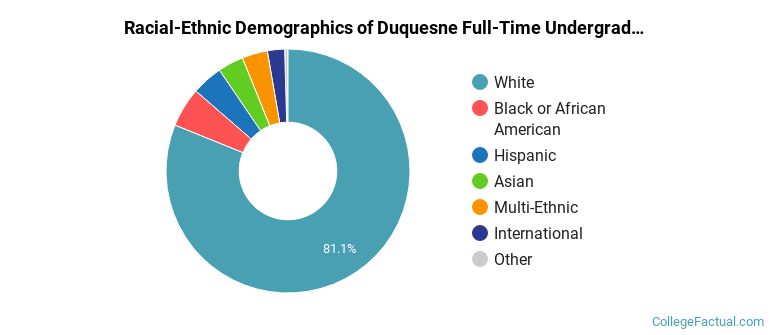
| Race/Ethnicity | Number |
|---|---|
| White | 4,279 |
| Black or African American | 276 |
| Hispanic | 243 |
| Asian | 190 |
| Multi-Ethnic | 180 |
| International | 96 |
| Unknown | 20 |
| Native Hawaiian or Pacific Islander | 4 |
See racial/ethnic breakdown for all students.
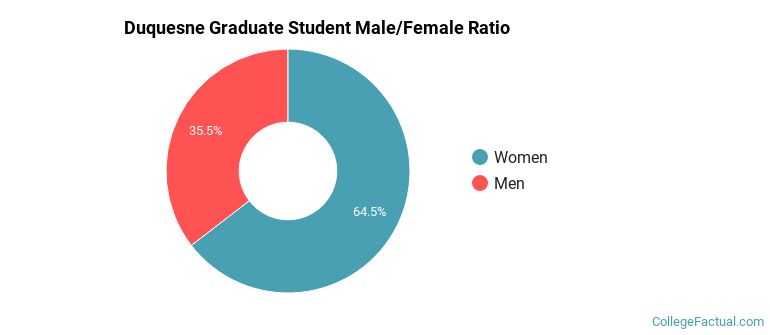
Male/Female Breakdown of Graduate Students
About 66% of full-time grad students are women, and 34% men.
For the gender breakdown for all students, go here.
Duquesne Racial-Ethnic Breakdown of Graduate Students
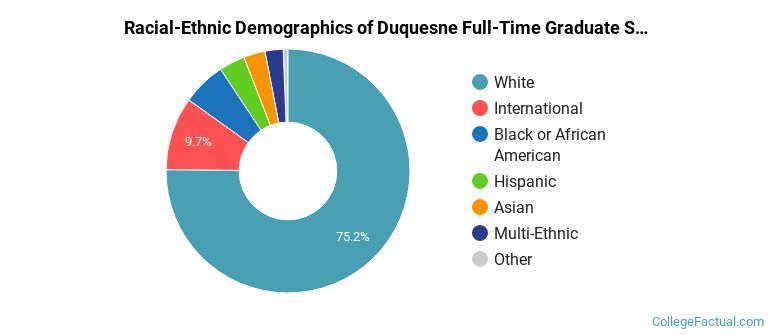
| Race/Ethnicity | Number |
|---|---|
| White | 2,287 |
| International | 266 |
| Black or African American | 185 |
| Hispanic | 134 |
| Asian | 97 |
| Multi-Ethnic | 78 |
| Unknown | 18 |
| Native Hawaiian or Pacific Islander | 2 |
See racial/ethnic breakdown for all students.
| Race/Ethnicity | Number |
|---|---|
| White | 6,868 |
| Black or African American | 503 |
| International | 431 |
| Hispanic | 390 |
| Asian | 307 |
| Multi-Ethnic | 274 |
| Unknown | 45 |
| Native Hawaiian or Pacific Islander | 6 |

There are approximately 5,756 female students and 3,074 male students at Duquesne.
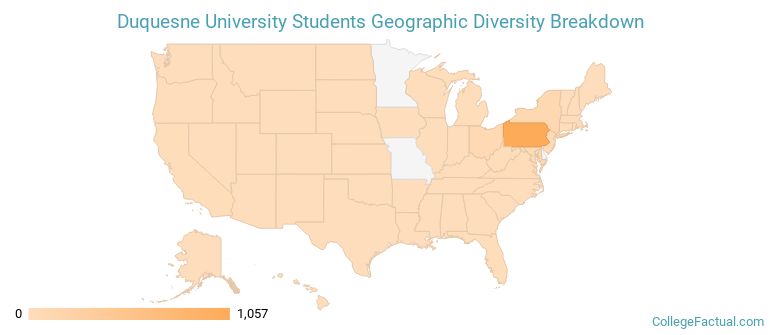
Duquesne ranks 715 out of 2,183 when it comes to geographic diversity.
30.03% of Duquesne students come from out of state, and 2.12% come from out of the country.
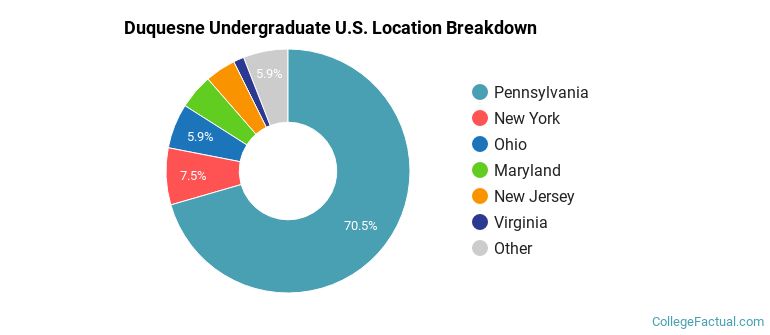
The undergraduate student body is split among 30 states (may include Washington D.C.). Click on the map for more detail.
| State | Amount |
|---|---|
| Pennsylvania | 1,057 |
| New York | 113 |
| Ohio | 89 |
| Maryland | 69 |
| New Jersey | 61 |
Students from 78 countries are represented at this school, with the majority of the international students coming from China, Saudi Arabia, and India.
Learn more about international students at Duquesne.
A traditional college student is defined as being between the ages of 18-21. At Duquesne, 59.08% of students fall into that category, compared to the national average of 60%.
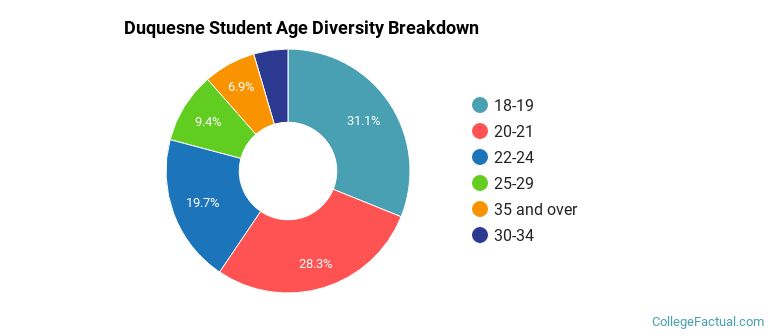
| Student Age Group | Amount |
|---|---|
| 18-19 | 2,841 |
| 20-21 | 2,588 |
| 22-24 | 1,796 |
| 25-29 | 858 |
| 35 and over | 632 |
| 30-34 | 415 |
| Under 18 | 0 |
Footnotes
*The racial-ethnic minorities count is calculated by taking the total number of students and subtracting white students, international students, and students whose race/ethnicity was unknown. This number is then divided by the total number of students at the school to obtain the racial-ethnic minorities percentage.
References
Department of Homeland Security Citizenship and Immigration Services
Read College Factual's Diversity Ranking Methodology.