ECU total enrollment is approximately 28,798 students. 18,886 are undergraduates and 2,585 are graduate students.
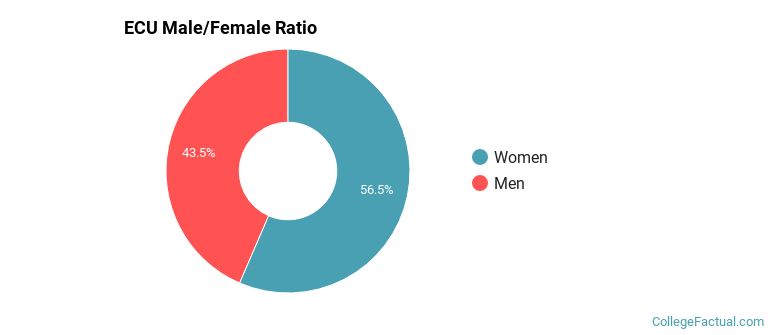
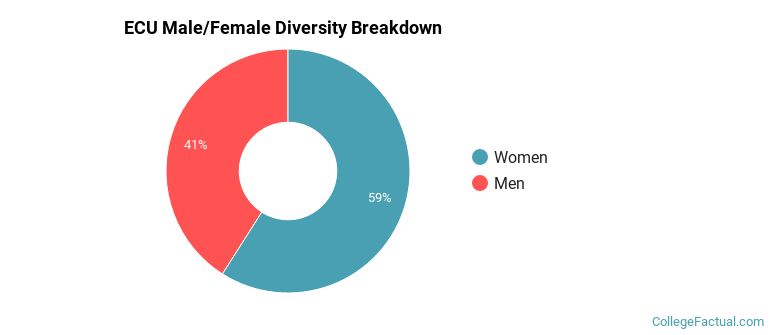
Male/Female Breakdown of Undergraduates
The full-time ECU undergraduate population is made up of 58% women, and 42% men.
For the gender breakdown for all students, go here.
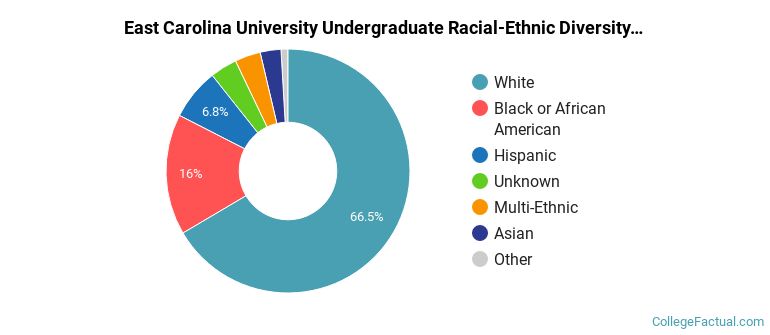
ECU Racial/Ethnic Breakdown of Undergraduates
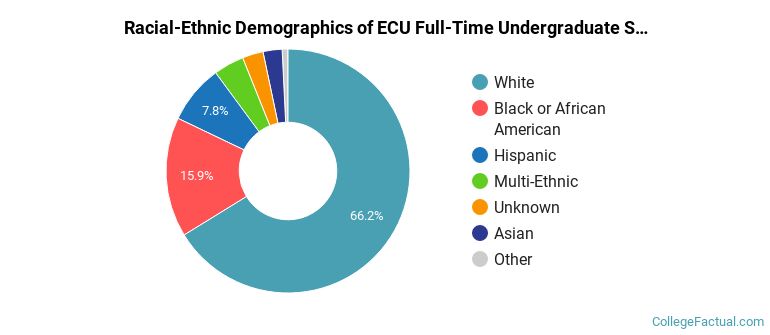
| Race/Ethnicity | Number |
|---|---|
| White | 12,265 |
| Black or African American | 3,009 |
| Hispanic | 1,602 |
| Multi-Ethnic | 749 |
| Unknown | 566 |
| Asian | 484 |
| International | 82 |
| Native Hawaiian or Pacific Islander | 25 |
See racial/ethnic breakdown for all students.
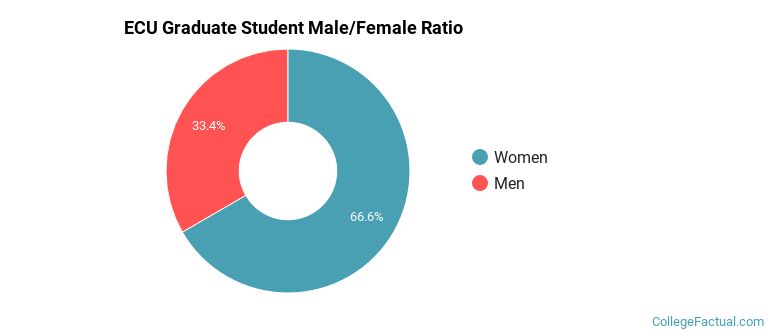
Male/Female Breakdown of Graduate Students
About 66% of full-time grad students are women, and 34% men.
For the gender breakdown for all students, go here.
ECU Racial-Ethnic Breakdown of Graduate Students
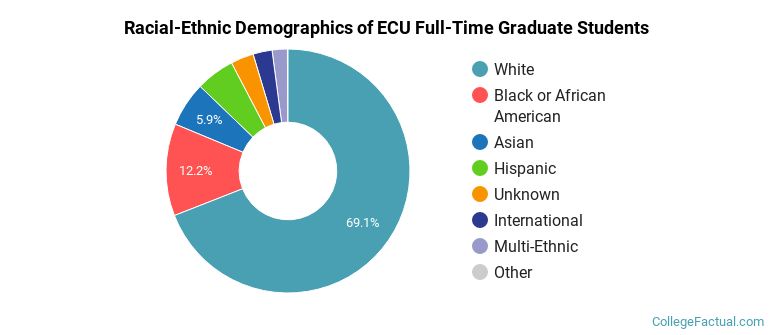
| Race/Ethnicity | Number |
|---|---|
| White | 1,754 |
| Black or African American | 326 |
| Asian | 158 |
| Hispanic | 141 |
| Unknown | 81 |
| Multi-Ethnic | 61 |
| International | 48 |
| Native Hawaiian or Pacific Islander | 2 |
See racial/ethnic breakdown for all students.
| Race/Ethnicity | Number |
|---|---|
| White | 18,708 |
| Black or African American | 4,710 |
| Hispanic | 2,144 |
| Unknown | 1,055 |
| Multi-Ethnic | 981 |
| Asian | 801 |
| International | 175 |
| Native Hawaiian or Pacific Islander | 36 |
There are approximately 17,292 female students and 11,506 male students at ECU.
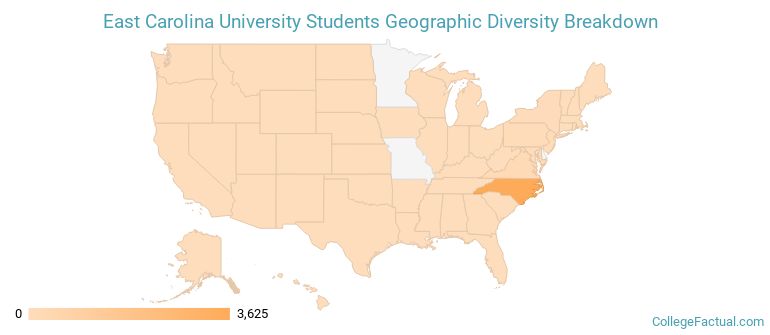
ECU ranks 904 out of 2,183 when it comes to geographic diversity.
15.6% of ECU students come from out of state, and 0.3% come from out of the country.
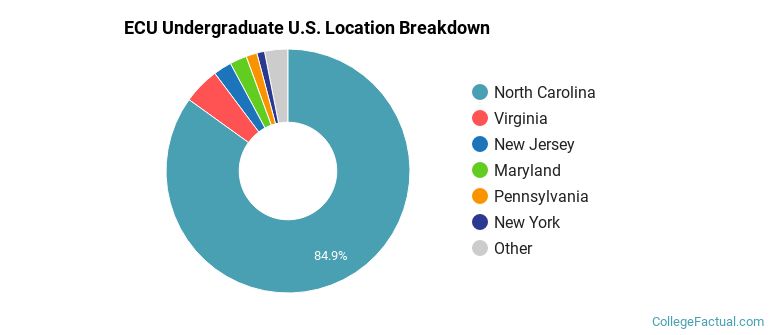
The undergraduate student body is split among 32 states (may include Washington D.C.). Click on the map for more detail.
| State | Amount |
|---|---|
| North Carolina | 3,625 |
| Virginia | 206 |
| New Jersey | 103 |
| Maryland | 96 |
| Pennsylvania | 62 |
Students from 67 countries are represented at this school, with the majority of the international students coming from India, China, and Saudi Arabia.
Learn more about international students at ECU.
A traditional college student is defined as being between the ages of 18-21. At ECU, 54.79% of students fall into that category, compared to the national average of 60%.
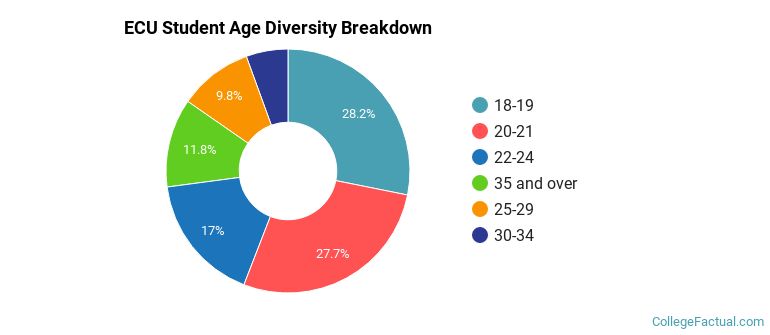
| Student Age Group | Amount |
|---|---|
| 18-19 | 8,042 |
| 20-21 | 7,918 |
| 22-24 | 4,860 |
| 35 and over | 3,360 |
| 25-29 | 2,794 |
| 30-34 | 1,587 |
| Under 18 | 0 |
Footnotes
*The racial-ethnic minorities count is calculated by taking the total number of students and subtracting white students, international students, and students whose race/ethnicity was unknown. This number is then divided by the total number of students at the school to obtain the racial-ethnic minorities percentage.
References
Department of Homeland Security Citizenship and Immigration Services
Image Credit: By Luca Masters under License