We've gathered data and other essential information about the program, such as the average salary of graduates, ethnicity of students, how many students graduated in recent times, and more. Also, learn how ETSU ranks among other schools offering degrees in cis.
Jump to any of the following sections:
The bachelor's program at ETSU was ranked #268 on College Factual's Best Schools for cis list. It is also ranked #2 in Tennessee.
During the 2021-2022 academic year, East Tennessee State University handed out 91 bachelor's degrees in computer information systems. This is an increase of 15% over the previous year when 79 degrees were handed out.
In 2022, 6 students received their master’s degree in cis from ETSU. This makes it the #243 most popular school for cis master’s degree candidates in the country.
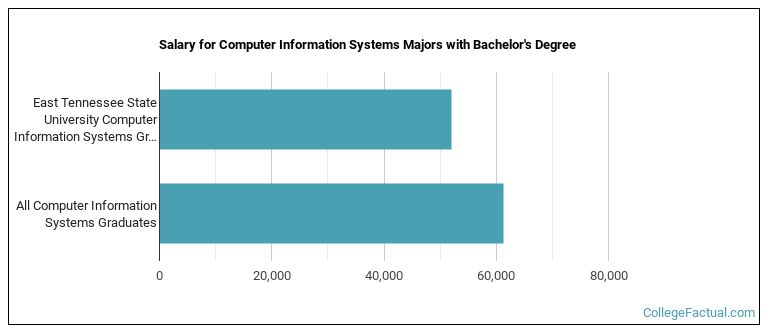
The median salary of cis students who receive their bachelor's degree at ETSU is $52,008. This is less than $61,300, which is the national median of all cis majors in the nation who earn bachelor's degrees.
In 2022-2023, the average part-time undergraduate tuition at ETSU was $444 per credit hour for out-of-state students. The average for in-state students was $316 per credit hour. Information about average full-time undergraduate tuition and fees is shown in the table below.
| In State | Out of State | |
|---|---|---|
| Tuition | $7,706 | $11,034 |
| Fees | $2,000 | $2,000 |
| Books and Supplies | $1,350 | $1,350 |
| On Campus Room and Board | $10,270 | $10,270 |
| On Campus Other Expenses | $6,930 | $6,930 |
Learn more about ETSU tuition and fees.
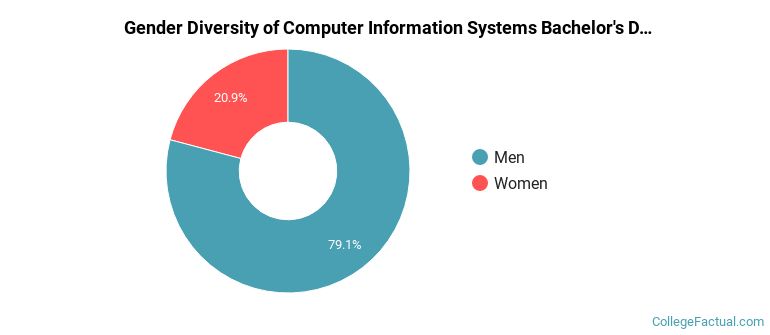
In the 2021-2022 academic year, 91 students earned a bachelor's degree in cis from ETSU. About 21% of these graduates were women and the other 79% were men.
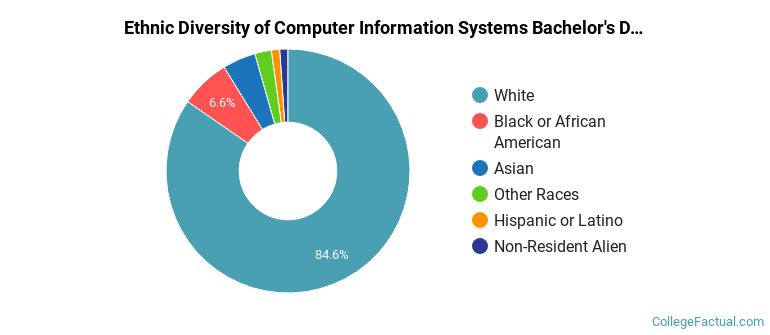
The majority of the students with this major are white. About 85% of 2022 graduates were in this category.
The following table and chart show the ethnic background for students who recently graduated from East Tennessee State University with a bachelor's in cis.
| Ethnic Background | Number of Students |
|---|---|
| Asian | 4 |
| Black or African American | 6 |
| Hispanic or Latino | 1 |
| White | 77 |
| Non-Resident Aliens | 1 |
| Other Races | 2 |
Online degrees for the ETSU cis bachelor’s degree program are not available at this time. To see if the school offers distance learning options in other areas, visit the ETSU Online Learning page.
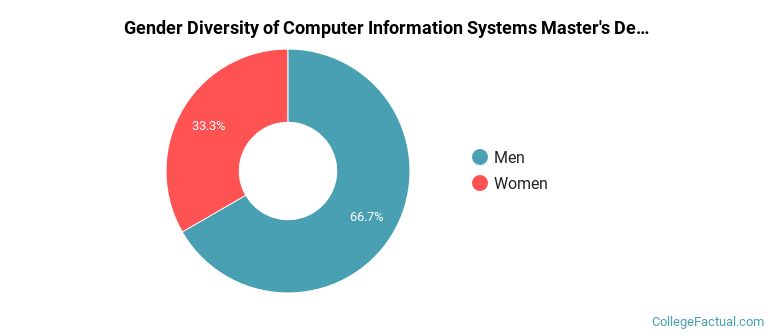
In the 2021-2022 academic year, 12 students earned a master's degree in cis from ETSU. About 33% of these graduates were women and the other 67% were men.
The majority of the students with this major are white. About 67% of 2022 graduates were in this category.
The following table and chart show the ethnic background for students who recently graduated from East Tennessee State University with a master's in cis.
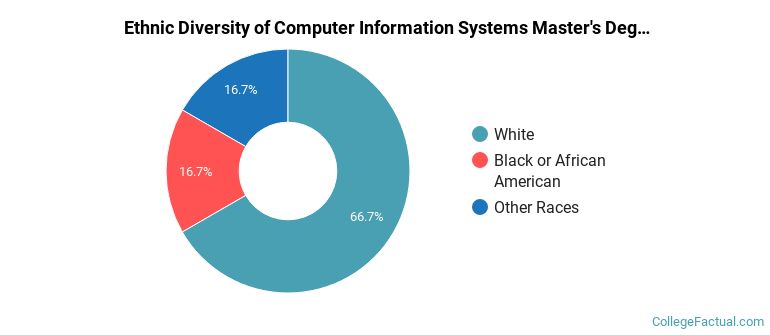
| Ethnic Background | Number of Students |
|---|---|
| Asian | 0 |
| Black or African American | 2 |
| Hispanic or Latino | 0 |
| White | 8 |
| Non-Resident Aliens | 0 |
| Other Races | 2 |
Take a look at the following statistics related to the make-up of the cis majors at East Tennessee State University.
| Related Major | Annual Graduates |
|---|---|
| Computer Software & Applications | 7 |
More about our data sources and methodologies.