ECSU total enrollment is approximately 4,644 students. 3,713 are undergraduates and 84 are graduate students.
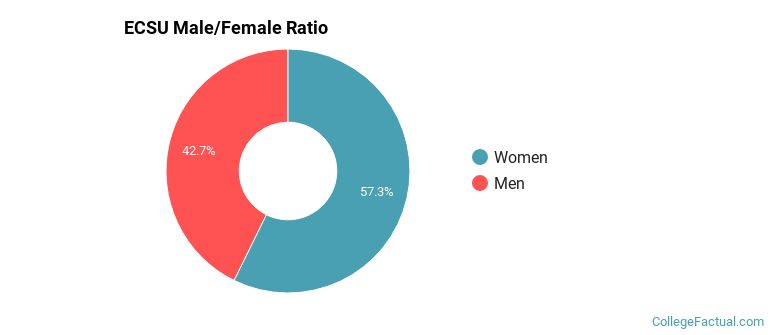
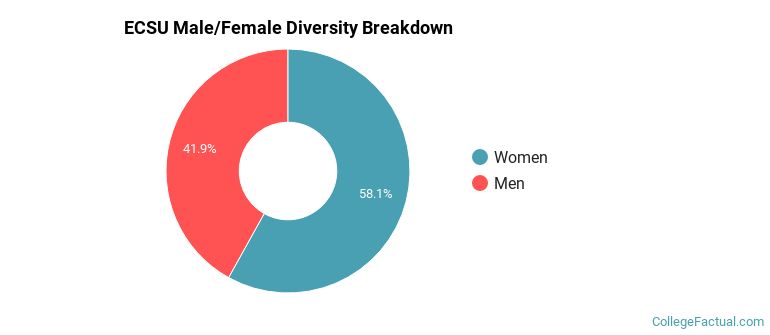
Male/Female Breakdown of Undergraduates
The full-time ECSU undergraduate population is made up of 58% women, and 42% men.
For the gender breakdown for all students, go here.
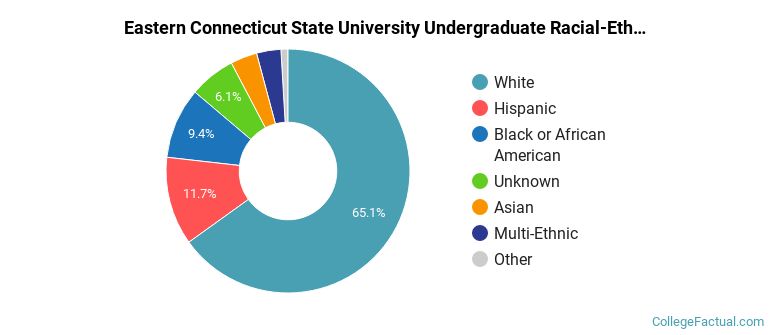
ECSU Racial/Ethnic Breakdown of Undergraduates
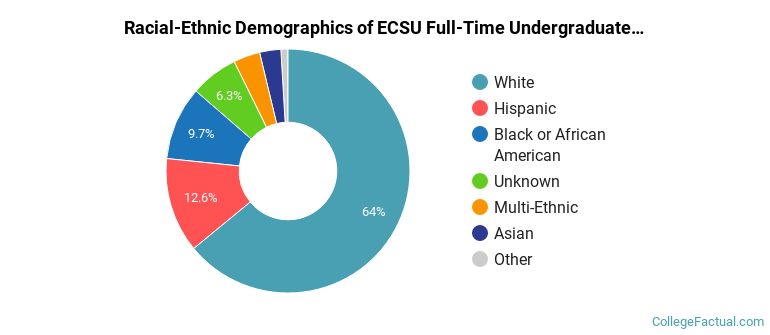
| Race/Ethnicity | Number |
|---|---|
| White | 2,362 |
| Hispanic | 484 |
| Black or African American | 337 |
| Unknown | 260 |
| Multi-Ethnic | 138 |
| Asian | 100 |
| International | 24 |
| Native Hawaiian or Pacific Islander | 3 |
See racial/ethnic breakdown for all students.
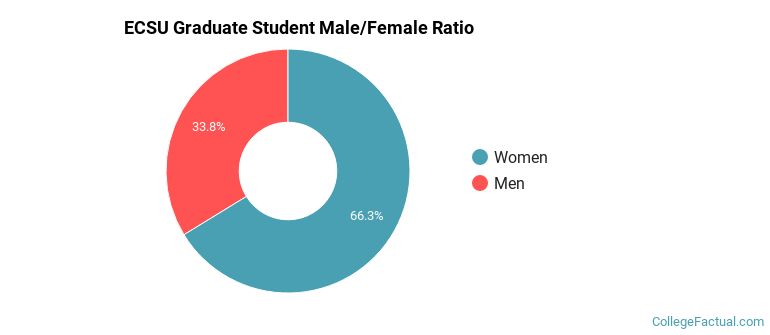
Male/Female Breakdown of Graduate Students
About 65% of full-time grad students are women, and 35% men.
For the gender breakdown for all students, go here.
ECSU Racial-Ethnic Breakdown of Graduate Students
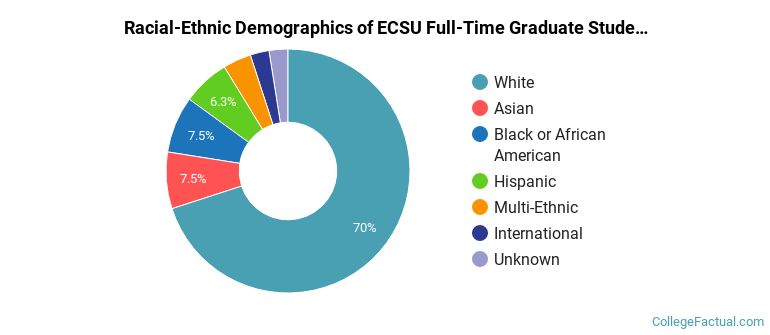
| Race/Ethnicity | Number |
|---|---|
| White | 68 |
| Hispanic | 6 |
| Asian | 3 |
| Multi-Ethnic | 3 |
| Black or African American | 2 |
| International | 2 |
| Native Hawaiian or Pacific Islander | 0 |
| Unknown | 0 |
See racial/ethnic breakdown for all students.
| Race/Ethnicity | Number |
|---|---|
| White | 3,001 |
| Hispanic | 584 |
| Black or African American | 395 |
| Unknown | 310 |
| Multi-Ethnic | 166 |
| Asian | 143 |
| International | 31 |
| Native Hawaiian or Pacific Islander | 4 |
There are approximately 2,719 female students and 1,925 male students at ECSU.
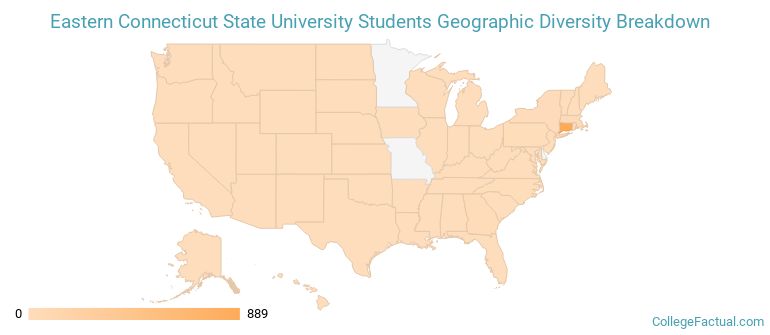
ECSU ranks 1,406 out of 2,183 when it comes to geographic diversity.
11.89% of ECSU students come from out of state, and 0.39% come from out of the country.
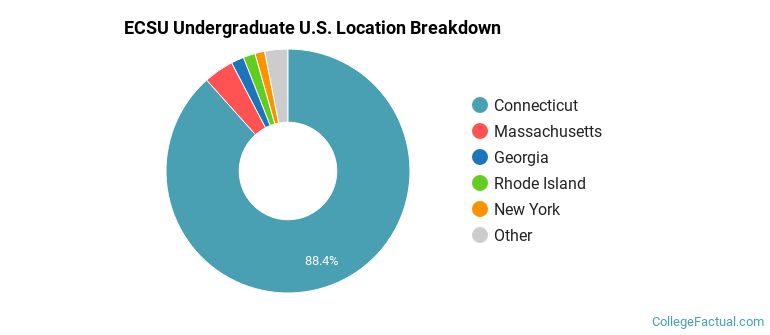
The undergraduate student body is split among 17 states (may include Washington D.C.). Click on the map for more detail.
| State | Amount |
|---|---|
| Connecticut | 889 |
| Massachusetts | 40 |
| Georgia | 17 |
| Rhode Island | 16 |
| New York | 13 |
Students from 30 countries are represented at this school, with the majority of the international students coming from China, Norway, and Saudi Arabia.
Learn more about international students at ECSU.
A traditional college student is defined as being between the ages of 18-21. At ECSU, 64.96% of students fall into that category, compared to the national average of 60%.
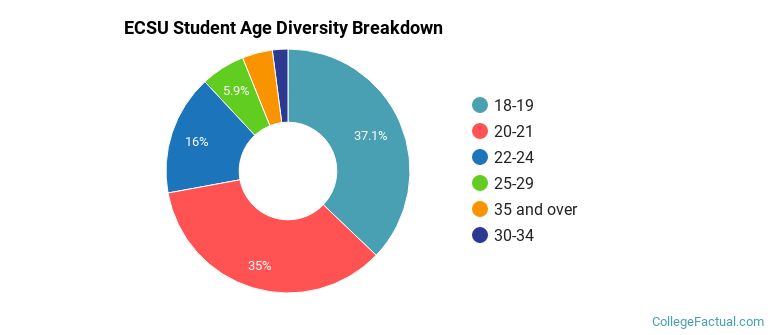
| Student Age Group | Amount |
|---|---|
| 18-19 | 1,767 |
| 20-21 | 1,664 |
| 22-24 | 759 |
| 25-29 | 279 |
| 35 and over | 191 |
| 30-34 | 98 |
| Under 18 | 0 |
Footnotes
*The racial-ethnic minorities count is calculated by taking the total number of students and subtracting white students, international students, and students whose race/ethnicity was unknown. This number is then divided by the total number of students at the school to obtain the racial-ethnic minorities percentage.
References
Department of Homeland Security Citizenship and Immigration Services
Image Credit: By John Phelan under License
Find out how College Factual created their Diversity Rankings.