We've gathered data and other essential information about the program, such as the ethnicity of students, how many students graduated in recent times, and more. In addition, we cover how EIU ranks in comparison to other schools with allied health programs.
Jump to any of the following sections:
Learn about start dates, transferring credits, availability of financial aid, and more by contacting the universities below.
Take your associate degree in an allied health field to the next level with this specialized transfer friendly online bachelor of science from Southern New Hampshire University.
The allied health major at EIU is not ranked on College Factual’s Best Colleges and Universities for Allied Health Professions. This could be for a number of reasons, such as not having enough data on the major or school to make an accurate assessment of its quality.
During the 2021-2022 academic year, Eastern Illinois University handed out 6 bachelor's degrees in allied health professions. This is an increase of 100% over the previous year when 3 degrees were handed out.
Out-of-state part-time undergraduates at EIU paid an average of $400 per credit hour in 2022-2023. The average for in-state students was $326 per credit hour. The average full-time tuition and fees for undergraduates are shown in the table below.
| In State | Out of State | |
|---|---|---|
| Tuition | $9,624 | $12,066 |
| Fees | $3,500 | $3,500 |
| Books and Supplies | $150 | $150 |
| On Campus Room and Board | $11,298 | $11,298 |
| On Campus Other Expenses | $2,768 | $2,768 |
Learn more about EIU tuition and fees.
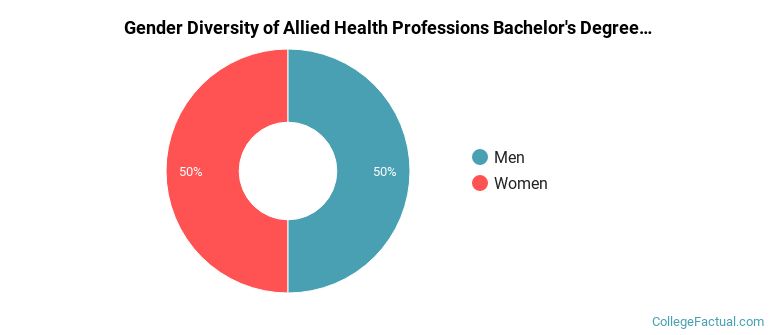
For the most recent academic year available, 50% of allied health bachelor's degrees went to men and 50% went to women.
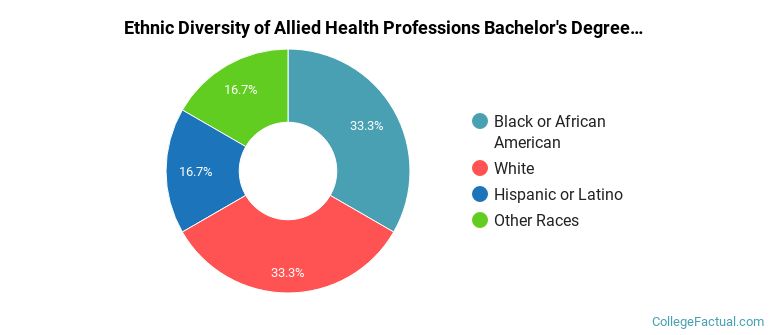
The following table and chart show the ethnic background for students who recently graduated from Eastern Illinois University with a bachelor's in allied health.
| Ethnic Background | Number of Students |
|---|---|
| Asian | 0 |
| Black or African American | 2 |
| Hispanic or Latino | 1 |
| White | 2 |
| Non-Resident Aliens | 0 |
| Other Races | 1 |
Online degrees for the EIU allied health bachelor’s degree program are not available at this time. To see if the school offers distance learning options in other areas, visit the EIU Online Learning page.
Take a look at the following statistics related to the make-up of the allied health majors at Eastern Illinois University.
| Related Major | Annual Graduates |
|---|---|
| Nursing | 46 |
| Communication Sciences | 45 |
| Dietetics & Clinical Nutrition Services | 24 |
| Public Health | 15 |
| Health & Medical Administrative Services | 7 |
More about our data sources and methodologies.
