EIU total enrollment is approximately 8,626 students. 4,082 are undergraduates and 615 are graduate students.
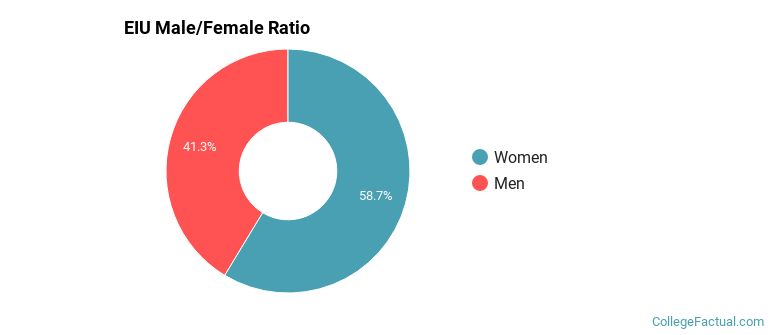
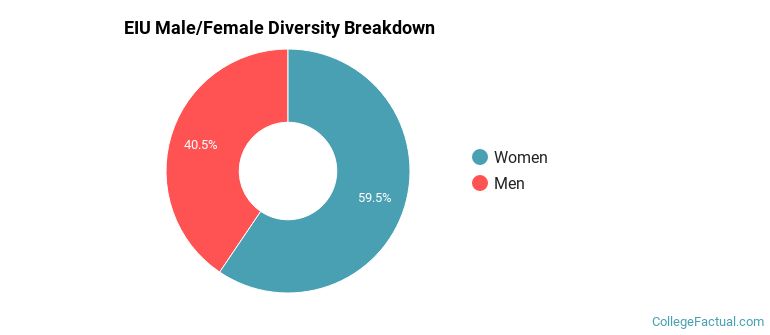
Male/Female Breakdown of Undergraduates
The full-time EIU undergraduate population is made up of 61% women, and 39% men.
For the gender breakdown for all students, go here.
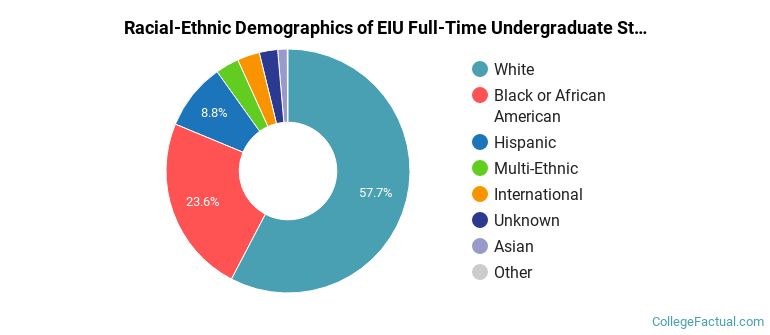
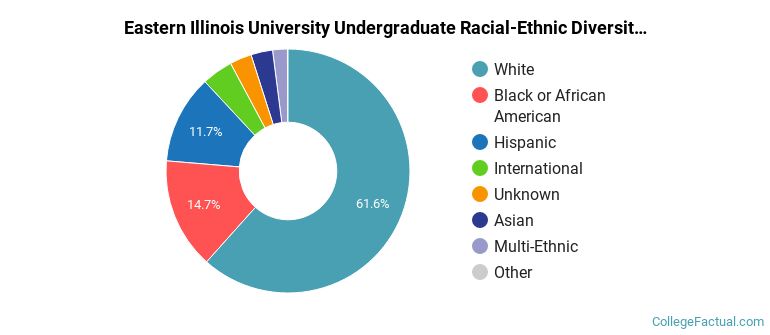
EIU Racial/Ethnic Breakdown of Undergraduates
| Race/Ethnicity | Number |
|---|---|
| White | 2,339 |
| Black or African American | 932 |
| Hispanic | 379 |
| Multi-Ethnic | 138 |
| Unknown | 125 |
| International | 108 |
| Asian | 49 |
| Native Hawaiian or Pacific Islander | 3 |
See racial/ethnic breakdown for all students.
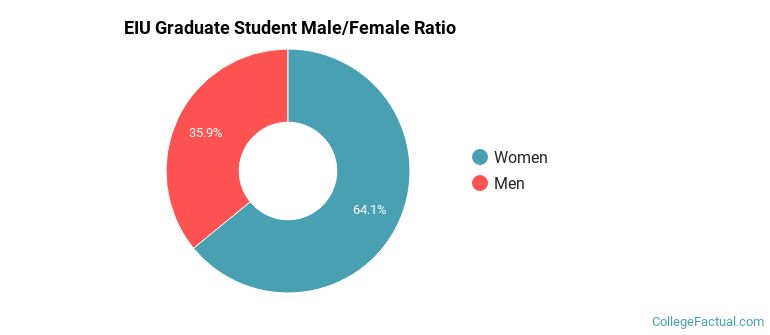
Male/Female Breakdown of Graduate Students
About 64% of full-time grad students are women, and 36% men.
For the gender breakdown for all students, go here.
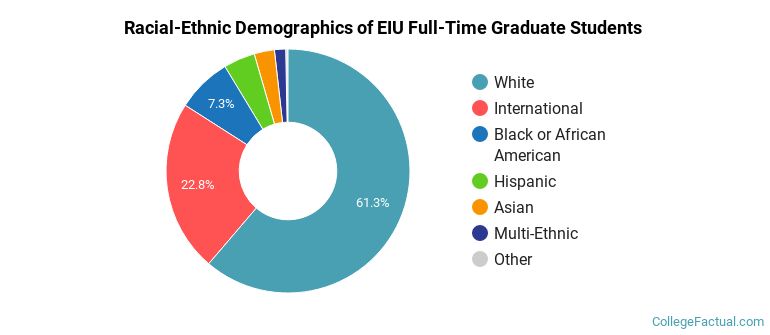
EIU Racial-Ethnic Breakdown of Graduate Students
| Race/Ethnicity | Number |
|---|---|
| White | 353 |
| International | 118 |
| Black or African American | 57 |
| Hispanic | 30 |
| Unknown | 27 |
| Asian | 16 |
| Multi-Ethnic | 14 |
| Native Hawaiian or Pacific Islander | 0 |
See racial/ethnic breakdown for all students.
| Race/Ethnicity | Number |
|---|---|
| White | 5,229 |
| Hispanic | 1,162 |
| Black or African American | 1,132 |
| Unknown | 373 |
| Asian | 274 |
| International | 263 |
| Multi-Ethnic | 173 |
| Native Hawaiian or Pacific Islander | 6 |
There are approximately 5,223 female students and 3,403 male students at EIU.
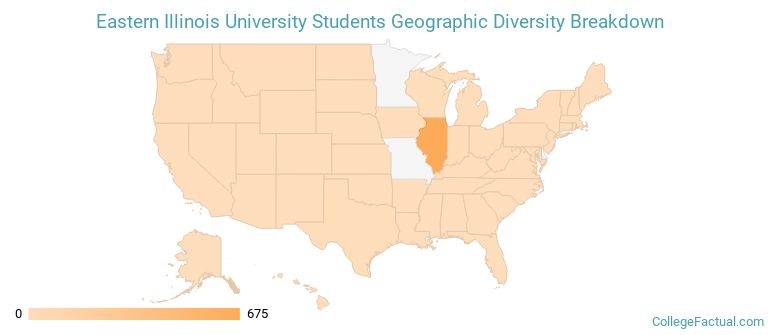
EIU ranks 1,320 out of 2,183 when it comes to geographic diversity.
9.85% of EIU students come from out of state, and 2.72% come from out of the country.
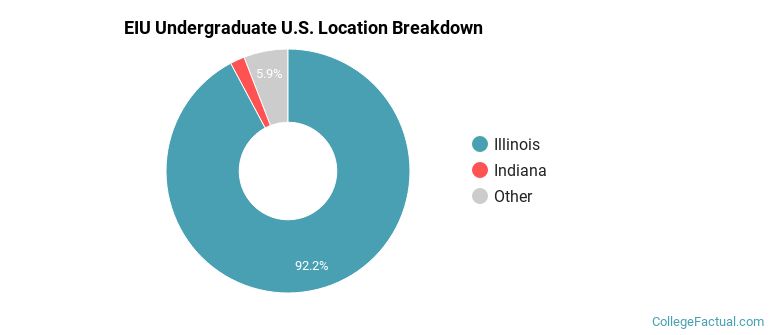
The undergraduate student body is split among 19 states (may include Washington D.C.). Click on the map for more detail.
| State | Amount |
|---|---|
| Illinois | 675 |
| Indiana | 14 |
| Wisconsin | 6 |
| Michigan | 5 |
| Iowa | 4 |
Students from 53 countries are represented at this school, with the majority of the international students coming from India, China, and Nigeria.
Learn more about international students at EIU.
A traditional college student is defined as being between the ages of 18-21. At EIU, 46.79% of students fall into that category, compared to the national average of 60%.
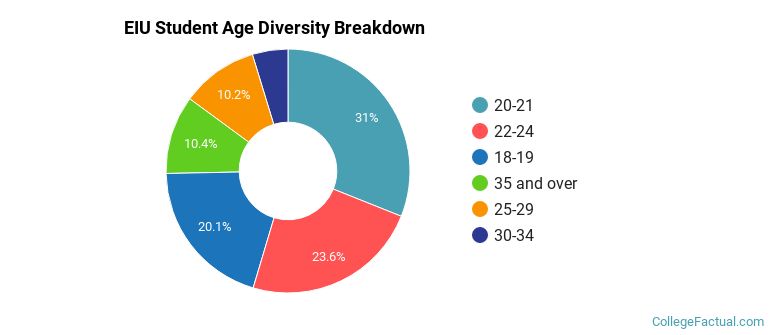
| Student Age Group | Amount |
|---|---|
| 20-21 | 1,998 |
| 22-24 | 1,516 |
| 18-19 | 1,291 |
| 35 and over | 670 |
| 25-29 | 656 |
| 30-34 | 304 |
| Under 18 | 0 |
Footnotes
*The racial-ethnic minorities count is calculated by taking the total number of students and subtracting white students, international students, and students whose race/ethnicity was unknown. This number is then divided by the total number of students at the school to obtain the racial-ethnic minorities percentage.
References
Department of Homeland Security Citizenship and Immigration Services
Read College Factual's Diversity Ranking Methodology.