ECPI University total enrollment is approximately 14,353 students. 13,869 are undergraduates and 370 are graduate students.
Male/Female Breakdown of Undergraduates
The full-time ECPI University undergraduate population is made up of 61% women, and 39% men.

For the gender breakdown for all students, go here.
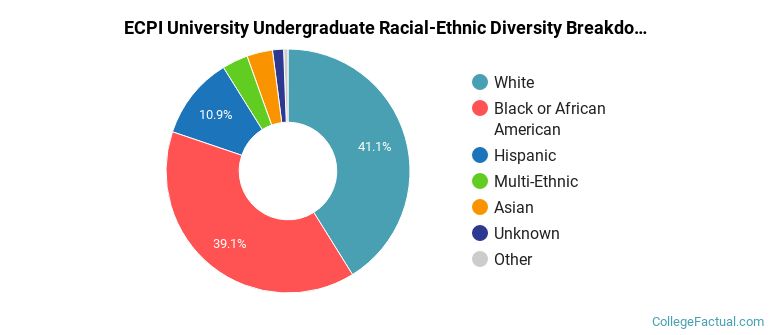
ECPI University Racial/Ethnic Breakdown of Undergraduates

| Race/Ethnicity | Number |
|---|---|
| Black or African American | 5,547 |
| White | 5,245 |
| Hispanic | 1,500 |
| Unknown | 498 |
| Multi-Ethnic | 492 |
| Asian | 419 |
| Native Hawaiian or Pacific Islander | 63 |
| International | 5 |
See racial/ethnic breakdown for all students.
Male/Female Breakdown of Graduate Students
About 54% of full-time grad students are women, and 46% men.

For the gender breakdown for all students, go here.
ECPI University Racial-Ethnic Breakdown of Graduate Students

| Race/Ethnicity | Number |
|---|---|
| White | 185 |
| Black or African American | 111 |
| Hispanic | 25 |
| Asian | 23 |
| Multi-Ethnic | 11 |
| Unknown | 8 |
| International | 4 |
| Native Hawaiian or Pacific Islander | 0 |
See racial/ethnic breakdown for all students.
| Race/Ethnicity | Number |
|---|---|
| Black or African American | 5,688 |
| White | 5,472 |
| Hispanic | 1,528 |
| Unknown | 537 |
| Multi-Ethnic | 508 |
| Asian | 445 |
| Native Hawaiian or Pacific Islander | 63 |
| International | 9 |

There are approximately 8,764 female students and 5,589 male students at ECPI University.
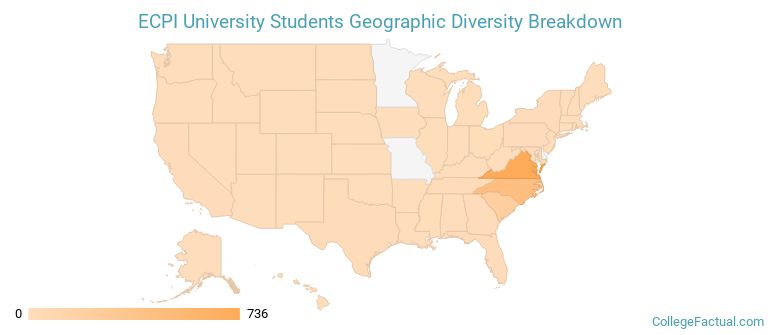
ECPI University ranks 335 out of 2,183 when it comes to geographic diversity.
53.46% of ECPI University students come from out of state, and 0.13% come from out of the country.
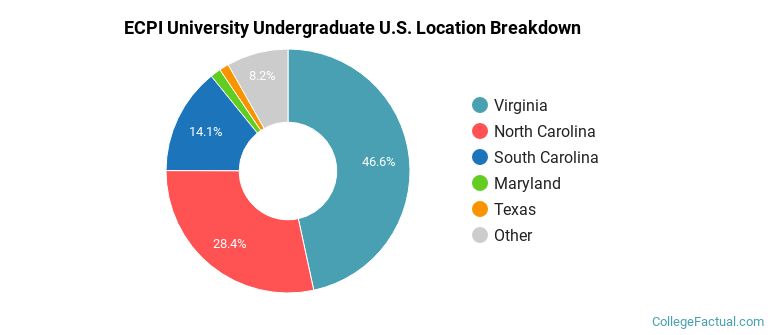
The undergraduate student body is split among 38 states (may include Washington D.C.). Click on the map for more detail.
| State | Amount |
|---|---|
| Virginia | 736 |
| North Carolina | 449 |
| South Carolina | 223 |
| Maryland | 22 |
| Texas | 20 |
Students from 9 countries are represented at this school, with the majority of the international students coming from India, Ethiopia, and Australia.
Learn more about international students at ECPI University.
A traditional college student is defined as being between the ages of 18-21. At ECPI University, 15.56% of students fall into that category, compared to the national average of 60%.
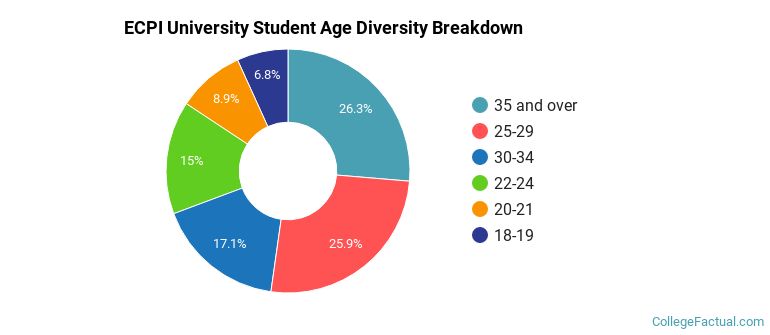
| Student Age Group | Amount |
|---|---|
| 35 and over | 3,126 |
| 25-29 | 3,076 |
| 30-34 | 2,027 |
| 22-24 | 1,781 |
| 20-21 | 1,057 |
| 18-19 | 806 |
| Under 18 | 0 |
Footnotes
*The racial-ethnic minorities count is calculated by taking the total number of students and subtracting white students, international students, and students whose race/ethnicity was unknown. This number is then divided by the total number of students at the school to obtain the racial-ethnic minorities percentage.
References