Elon total enrollment is approximately 7,117 students. 6,073 are undergraduates and 745 are graduate students.
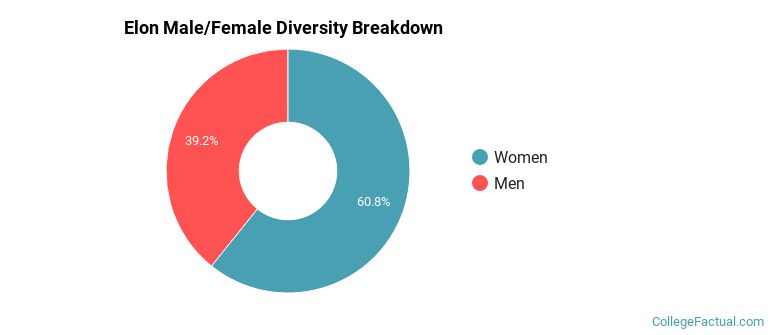
Male/Female Breakdown of Undergraduates
The full-time Elon undergraduate population is made up of 60% women, and 40% men.
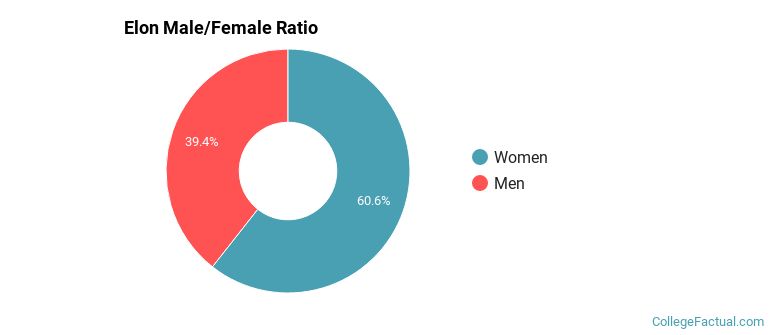
For the gender breakdown for all students, go here.
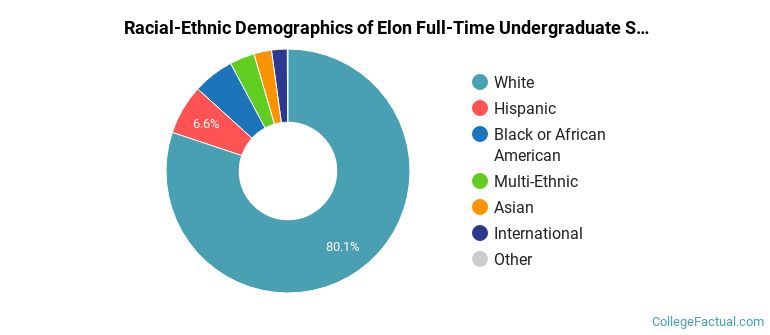
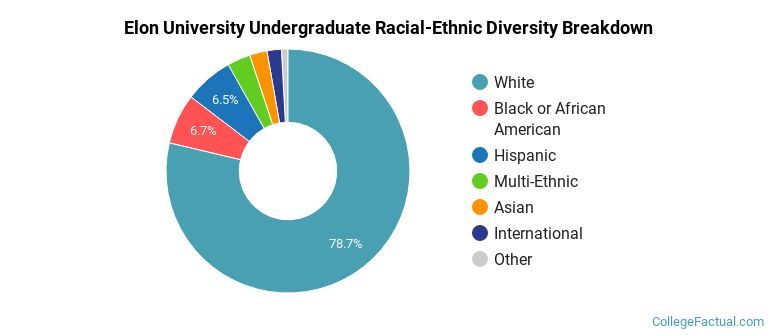
Elon Racial/Ethnic Breakdown of Undergraduates
| Race/Ethnicity | Number |
|---|---|
| White | 4,869 |
| Hispanic | 392 |
| Black or African American | 353 |
| Multi-Ethnic | 177 |
| Asian | 129 |
| International | 115 |
| Unknown | 30 |
| Native Hawaiian or Pacific Islander | 0 |
See racial/ethnic breakdown for all students.
Male/Female Breakdown of Graduate Students
About 63% of full-time grad students are women, and 37% men.
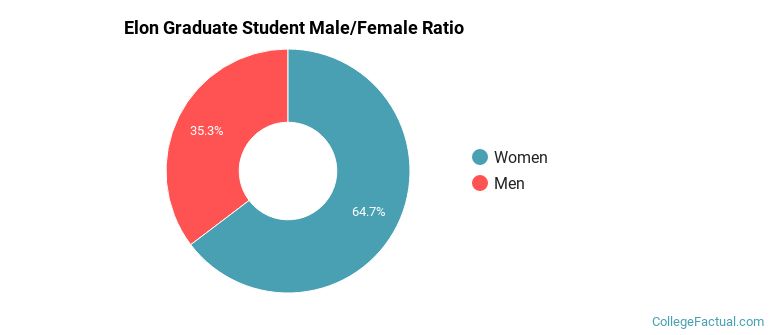
For the gender breakdown for all students, go here.
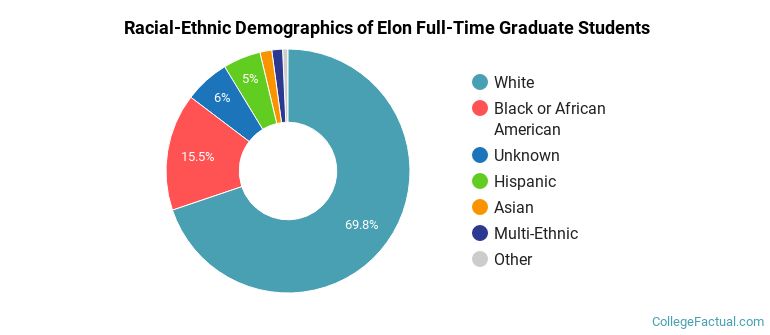
Elon Racial-Ethnic Breakdown of Graduate Students
| Race/Ethnicity | Number |
|---|---|
| White | 514 |
| Black or African American | 109 |
| Hispanic | 48 |
| Unknown | 43 |
| Multi-Ethnic | 12 |
| International | 9 |
| Asian | 6 |
| Native Hawaiian or Pacific Islander | 0 |
See racial/ethnic breakdown for all students.
| Race/Ethnicity | Number |
|---|---|
| White | 5,584 |
| Black or African American | 483 |
| Hispanic | 462 |
| Multi-Ethnic | 193 |
| Asian | 155 |
| International | 129 |
| Unknown | 99 |
| Native Hawaiian or Pacific Islander | 0 |
There are approximately 4,272 female students and 2,845 male students at Elon.
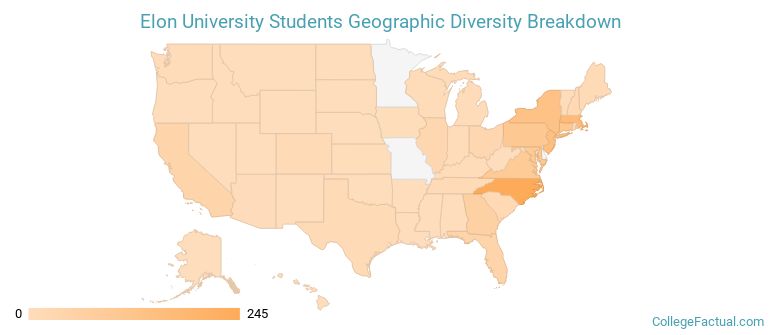
Elon ranks 125 out of 2,183 when it comes to geographic diversity.
82.31% of Elon students come from out of state, and 2.32% come from out of the country.
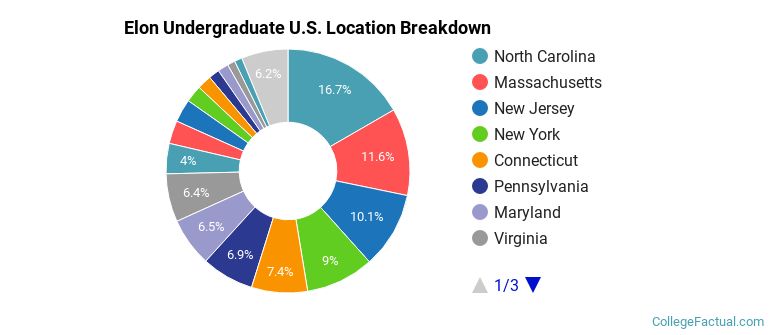
The undergraduate student body is split among 38 states (may include Washington D.C.). Click on the map for more detail.
| State | Amount |
|---|---|
| North Carolina | 245 |
| Massachusetts | 170 |
| New Jersey | 149 |
| New York | 133 |
| Connecticut | 109 |
Students from 52 countries are represented at this school, with the majority of the international students coming from United Kingdom, China, and Canada.
Learn more about international students at Elon.
A traditional college student is defined as being between the ages of 18-21. At Elon, 82.83% of students fall into that category, compared to the national average of 60%.
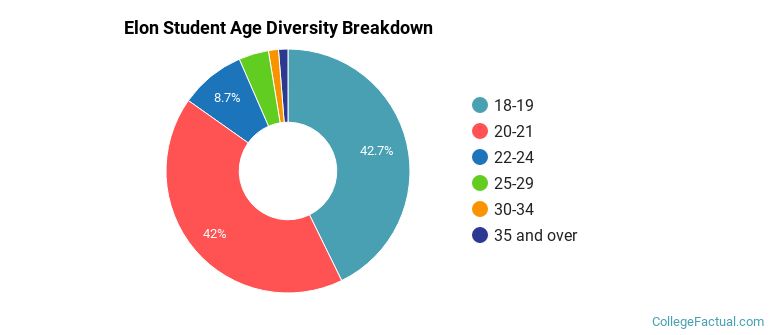
| Student Age Group | Amount |
|---|---|
| 18-19 | 2,836 |
| 20-21 | 2,789 |
| 22-24 | 575 |
| 25-29 | 263 |
| 30-34 | 88 |
| 35 and over | 83 |
| Under 18 | 0 |
Footnotes
*The racial-ethnic minorities count is calculated by taking the total number of students and subtracting white students, international students, and students whose race/ethnicity was unknown. This number is then divided by the total number of students at the school to obtain the racial-ethnic minorities percentage.
References
Department of Homeland Security Citizenship and Immigration Services
Find out how College Factual created their Diversity Rankings.