Emerson total enrollment is approximately 5,115 students. 3,626 are undergraduates and 1,044 are graduate students.
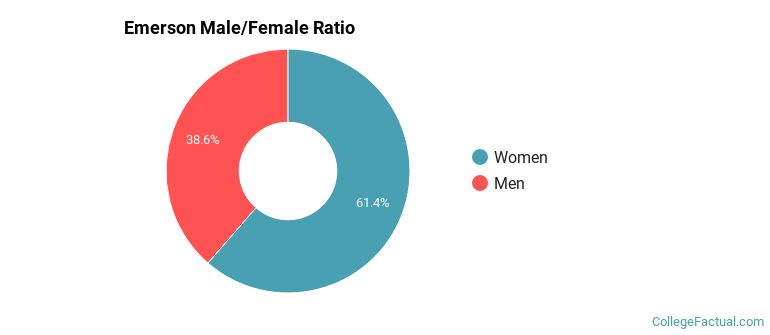
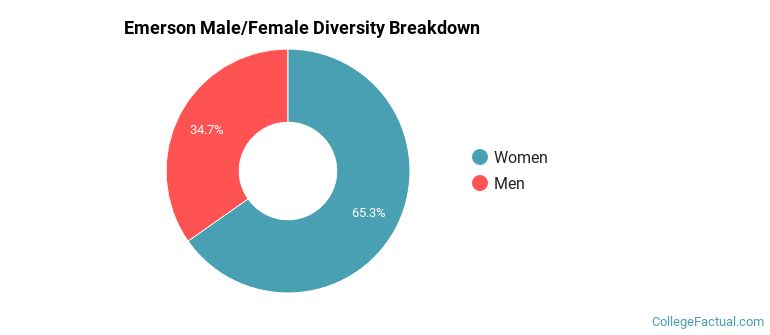
Male/Female Breakdown of Undergraduates
The full-time Emerson undergraduate population is made up of 63% women, and 37% men.
For the gender breakdown for all students, go here.
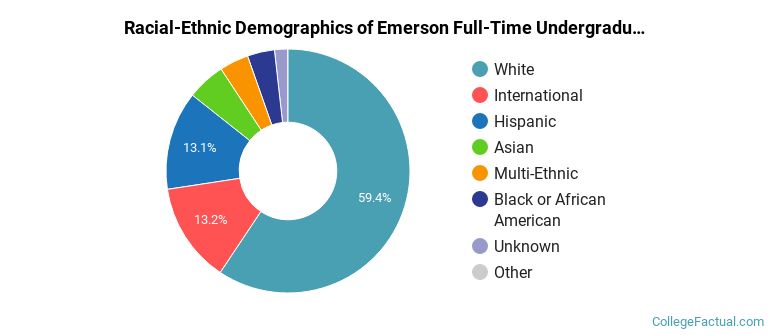
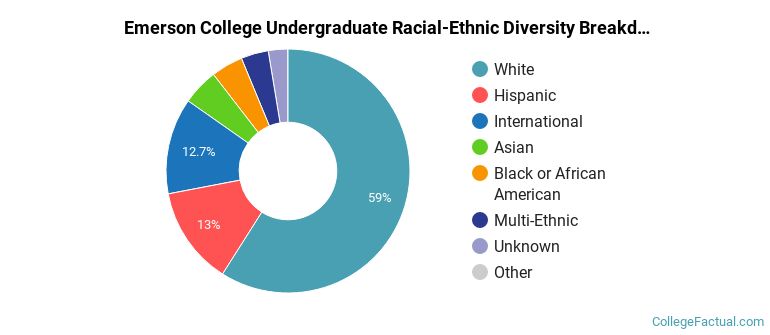
Emerson Racial/Ethnic Breakdown of Undergraduates
| Race/Ethnicity | Number |
|---|---|
| White | 2,126 |
| International | 480 |
| Hispanic | 454 |
| Asian | 186 |
| Black or African American | 147 |
| Multi-Ethnic | 146 |
| Unknown | 83 |
| Native Hawaiian or Pacific Islander | 2 |
See racial/ethnic breakdown for all students.
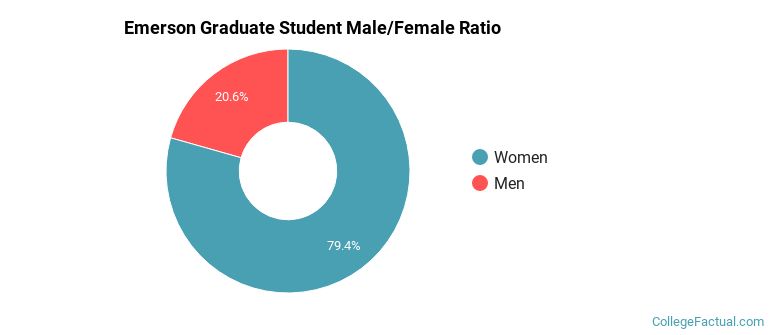
Male/Female Breakdown of Graduate Students
About 85% of full-time grad students are women, and 15% men.
For the gender breakdown for all students, go here.
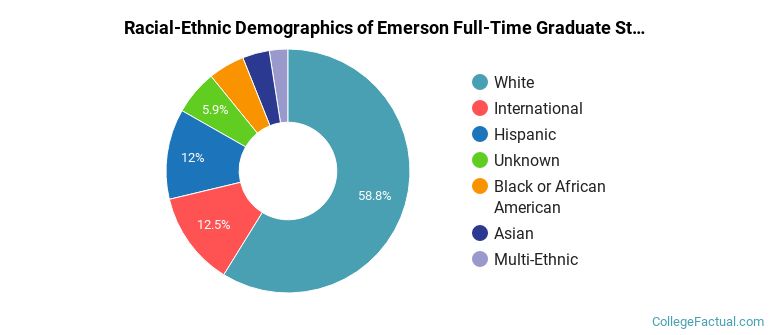
Emerson Racial-Ethnic Breakdown of Graduate Students
| Race/Ethnicity | Number |
|---|---|
| White | 610 |
| Hispanic | 172 |
| International | 74 |
| Black or African American | 69 |
| Unknown | 45 |
| Asian | 38 |
| Multi-Ethnic | 29 |
| Native Hawaiian or Pacific Islander | 2 |
See racial/ethnic breakdown for all students.
| Race/Ethnicity | Number |
|---|---|
| White | 2,970 |
| Hispanic | 718 |
| International | 573 |
| Black or African American | 251 |
| Asian | 248 |
| Multi-Ethnic | 190 |
| Unknown | 153 |
| Native Hawaiian or Pacific Islander | 4 |
There are approximately 3,527 female students and 1,588 male students at Emerson.
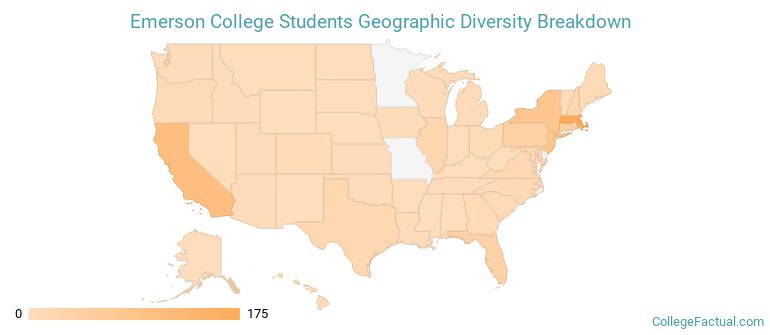
Emerson ranks 99 out of 2,183 when it comes to geographic diversity.
78.15% of Emerson students come from out of state, and 7.6% come from out of the country.
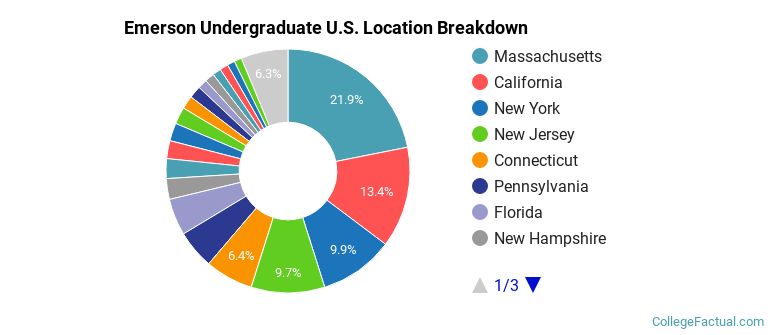
The undergraduate student body is split among 38 states (may include Washington D.C.). Click on the map for more detail.
| State | Amount |
|---|---|
| Massachusetts | 175 |
| California | 107 |
| New York | 79 |
| New Jersey | 78 |
| Connecticut | 51 |
Students from 70 countries are represented at this school, with the majority of the international students coming from China, Taiwan, and India.
Learn more about international students at Emerson.
A traditional college student is defined as being between the ages of 18-21. At Emerson, 75.64% of students fall into that category, compared to the national average of 60%.
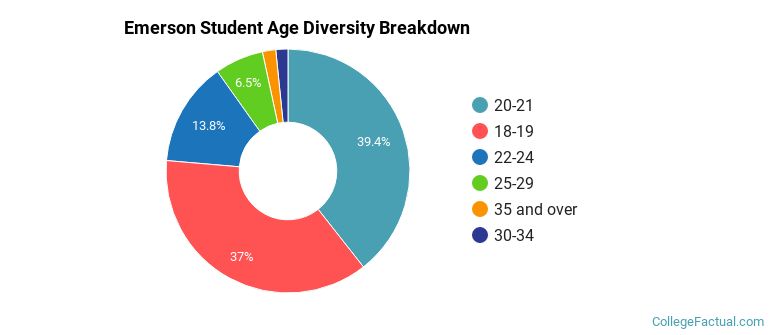
| Student Age Group | Amount |
|---|---|
| 20-21 | 1,740 |
| 18-19 | 1,633 |
| 22-24 | 610 |
| 25-29 | 285 |
| 35 and over | 78 |
| 30-34 | 71 |
| Under 18 | 0 |
Footnotes
*The racial-ethnic minorities count is calculated by taking the total number of students and subtracting white students, international students, and students whose race/ethnicity was unknown. This number is then divided by the total number of students at the school to obtain the racial-ethnic minorities percentage.
References
Department of Homeland Security Citizenship and Immigration Services
Image Credit: By McDonald & Gill under License
Read College Factual's Diversity Ranking Methodology.