Emory total enrollment is approximately 13,997 students. 6,814 are undergraduates and 5,915 are graduate students.
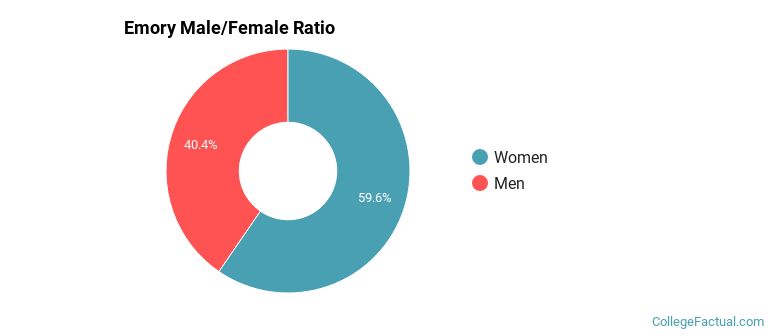
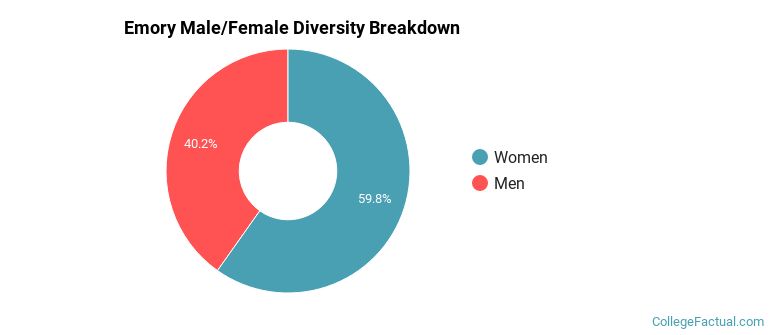
Male/Female Breakdown of Undergraduates
The full-time Emory undergraduate population is made up of 59% women, and 41% men.
For the gender breakdown for all students, go here.
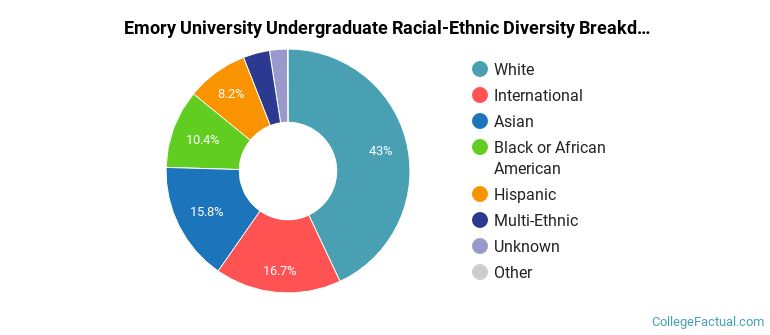
Emory Racial/Ethnic Breakdown of Undergraduates
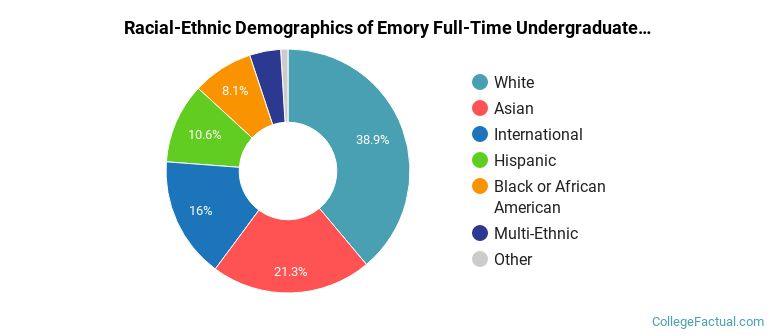
| Race/Ethnicity | Number |
|---|---|
| White | 2,502 |
| Asian | 1,577 |
| International | 1,052 |
| Hispanic | 742 |
| Black or African American | 588 |
| Multi-Ethnic | 291 |
| Unknown | 56 |
| Native Hawaiian or Pacific Islander | 2 |
See racial/ethnic breakdown for all students.
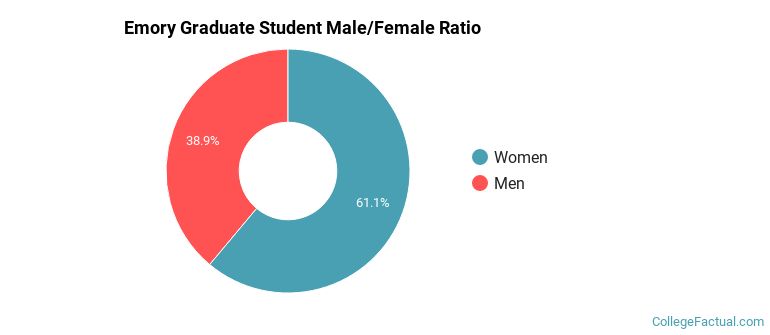
Male/Female Breakdown of Graduate Students
About 63% of full-time grad students are women, and 37% men.
For the gender breakdown for all students, go here.
Emory Racial-Ethnic Breakdown of Graduate Students
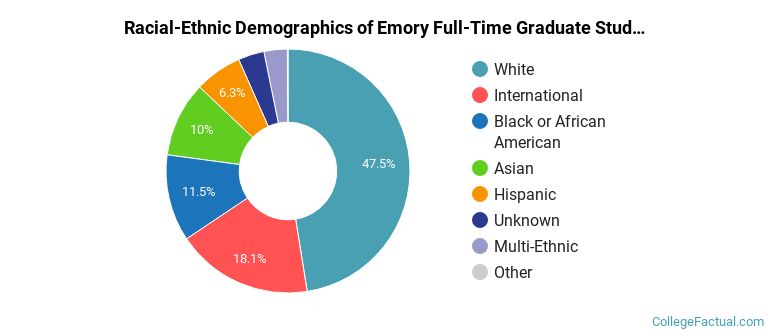
| Race/Ethnicity | Number |
|---|---|
| White | 2,776 |
| International | 929 |
| Black or African American | 773 |
| Asian | 634 |
| Hispanic | 411 |
| Multi-Ethnic | 197 |
| Unknown | 185 |
| Native Hawaiian or Pacific Islander | 4 |
See racial/ethnic breakdown for all students.
| Race/Ethnicity | Number |
|---|---|
| White | 5,811 |
| Asian | 2,357 |
| International | 2,164 |
| Black or African American | 1,613 |
| Hispanic | 1,219 |
| Multi-Ethnic | 534 |
| Unknown | 279 |
| Native Hawaiian or Pacific Islander | 7 |
There are approximately 8,510 female students and 5,487 male students at Emory.
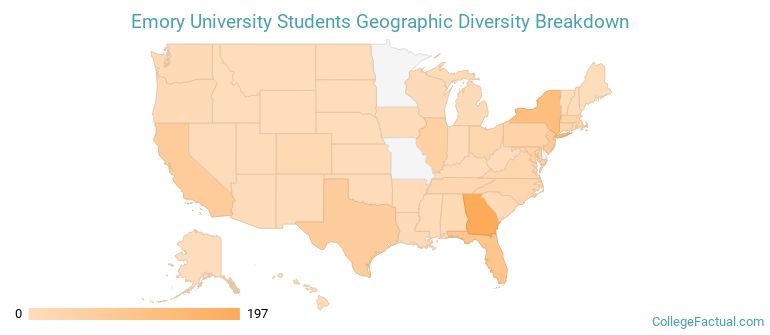
Emory ranks 38 out of 2,183 when it comes to geographic diversity.
82.06% of Emory students come from out of state, and 18.19% come from out of the country.
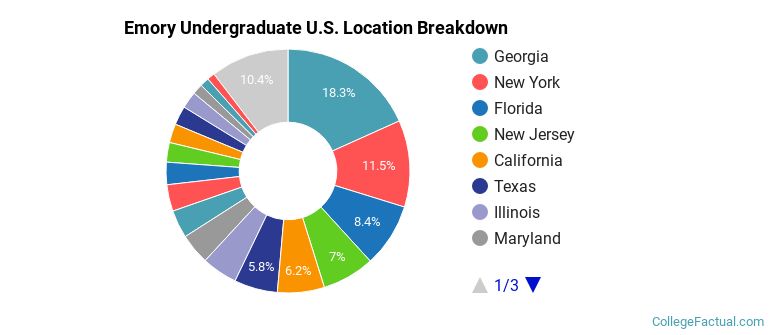
The undergraduate student body is split among 43 states (may include Washington D.C.). Click on the map for more detail.
| State | Amount |
|---|---|
| Georgia | 197 |
| New York | 124 |
| Florida | 91 |
| New Jersey | 75 |
| California | 67 |
Students from 102 countries are represented at this school, with the majority of the international students coming from China, South Korea, and India.
Learn more about international students at Emory.
A traditional college student is defined as being between the ages of 18-21. At Emory, 41.78% of students fall into that category, compared to the national average of 60%.
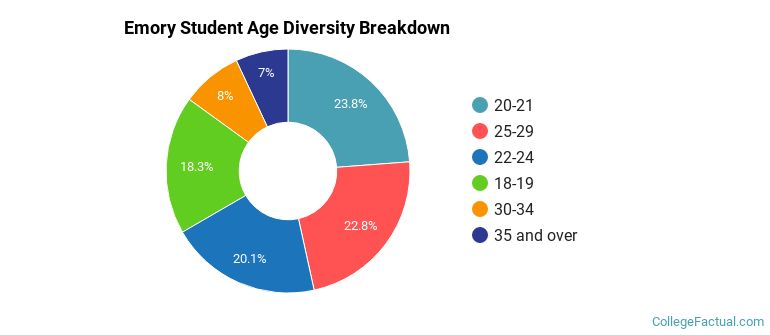
| Student Age Group | Amount |
|---|---|
| 20-21 | 3,365 |
| 25-29 | 3,218 |
| 22-24 | 2,839 |
| 18-19 | 2,594 |
| 30-34 | 1,138 |
| 35 and over | 985 |
| Under 18 | 0 |
Footnotes
*The racial-ethnic minorities count is calculated by taking the total number of students and subtracting white students, international students, and students whose race/ethnicity was unknown. This number is then divided by the total number of students at the school to obtain the racial-ethnic minorities percentage.
References
Department of Homeland Security Citizenship and Immigration Services
Read College Factual's Diversity Ranking Methodology.