We've gathered data and other essential information about the program, such as the ethnicity of students, how many students graduated in recent times, and more. In addition, we cover how Empire College ranks in comparison to other schools with business support programs.
Jump to any of the following sections:
The business support major at Empire College is not ranked on College Factual’s Best Colleges and Universities for Business Support & Assistant Services. This could be for a number of reasons, such as not having enough data on the major or school to make an accurate assessment of its quality.
Online degrees for the Empire College business support bachelor’s degree program are not available at this time. To see if the school offers distance learning options in other areas, visit the Empire College Online Learning page.
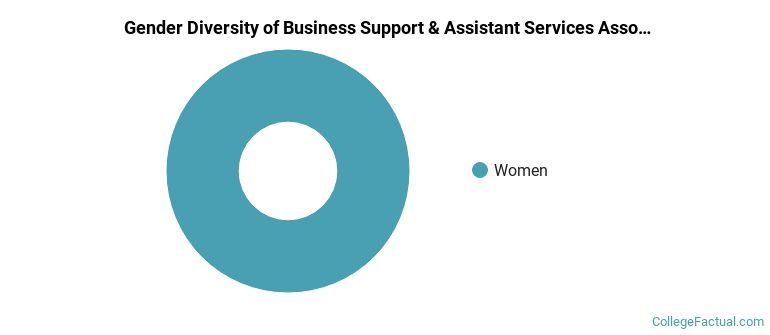
All of the 5 students who graduated with a Associate’s in business support from Empire College in 2022 were women.
The majority of the associate's degree graduates for this major are Hispanic or Latino. In the most recent graduating class for which data is available, 80% of grads fell into this category.
The following table and chart show the ethnic background for students who recently graduated from Empire College with a associate's in business support.
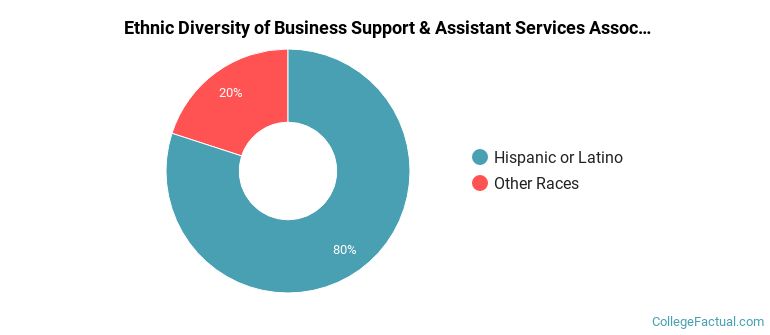
| Ethnic Background | Number of Students |
|---|---|
| Asian | 0 |
| Black or African American | 0 |
| Hispanic or Latino | 4 |
| White | 0 |
| Non-Resident Aliens | 0 |
| Other Races | 1 |
| Related Major | Annual Graduates |
|---|---|
| Accounting | 6 |
View All Business Support & Assistant Services Related Majors >