Enterprise-Ozark Community College total enrollment is approximately 1,808 students.
Male/Female Breakdown of Undergraduates
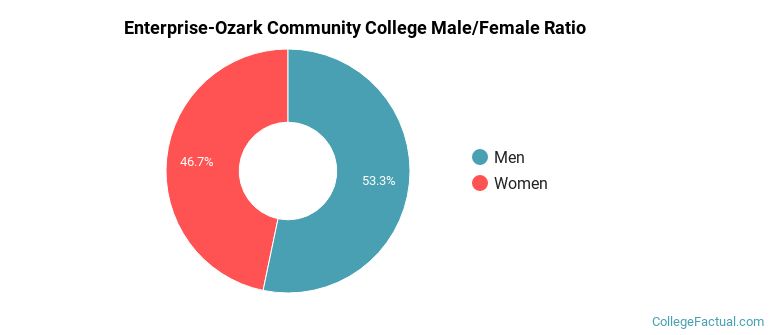
The full-time Enterprise-Ozark Community College undergraduate population is made up of 43% women, and 57% men.
For the gender breakdown for all students, go here.
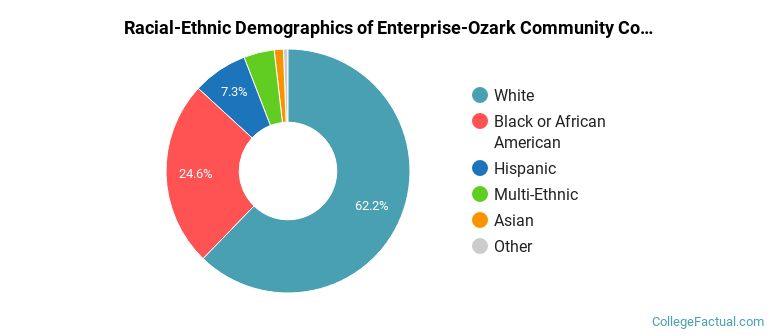
Enterprise-Ozark Community College Racial/Ethnic Breakdown of Undergraduates
| Race/Ethnicity | Number |
|---|---|
| White | 544 |
| Black or African American | 178 |
| Hispanic | 66 |
| Unknown | 47 |
| Multi-Ethnic | 41 |
| Asian | 3 |
| International | 3 |
| Native Hawaiian or Pacific Islander | 1 |
See racial/ethnic breakdown for all students.
| Race/Ethnicity | Number |
|---|---|
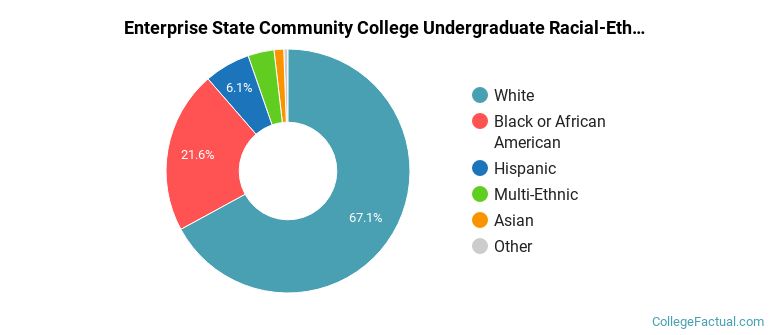
| White | 1,055 |
| Black or African American | 331 |
| Unknown | 172 |
| Hispanic | 127 |
| Multi-Ethnic | 80 |
| Asian | 16 |
| International | 9 |
| Native Hawaiian or Pacific Islander | 4 |
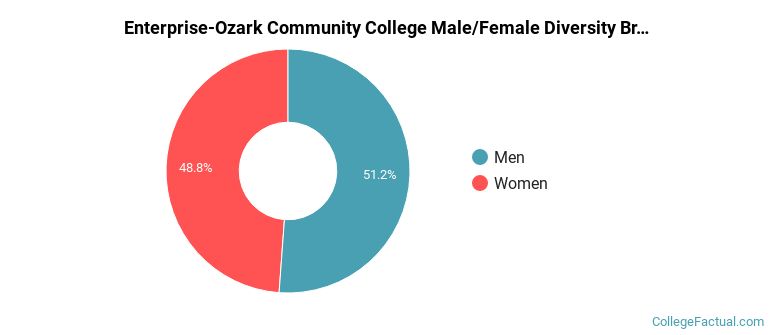
There are approximately 837 female students and 971 male students at Enterprise-Ozark Community College.
Students from 2 countries are represented at this school, with the majority of the international students coming from Honduras, and India.
Learn more about international students at Enterprise-Ozark Community College.
A traditional college student is defined as being between the ages of 18-21. At Enterprise-Ozark Community College, 47.58% of students fall into that category, compared to the national average of 60%.
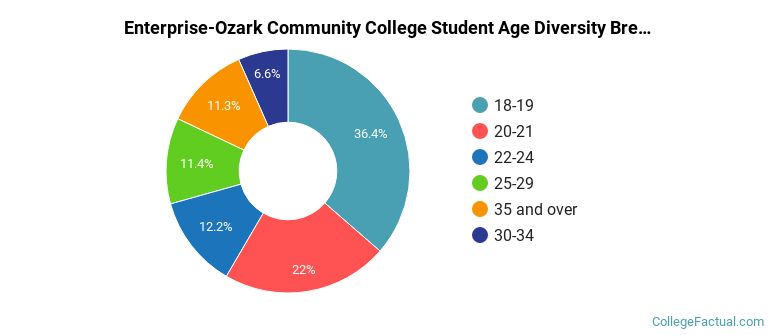
| Student Age Group | Amount |
|---|---|
| 18-19 | 527 |
| 20-21 | 319 |
| 22-24 | 177 |
| 25-29 | 165 |
| 35 and over | 164 |
| 30-34 | 96 |
| Under 18 | 0 |
Footnotes
*The racial-ethnic minorities count is calculated by taking the total number of students and subtracting white students, international students, and students whose race/ethnicity was unknown. This number is then divided by the total number of students at the school to obtain the racial-ethnic minorities percentage.
References
Department of Homeland Security Citizenship and Immigration Services
Read College Factual's Diversity Ranking Methodology.