Excelsior College total enrollment is approximately 21,974 students.
See racial/ethnic breakdown for all students.
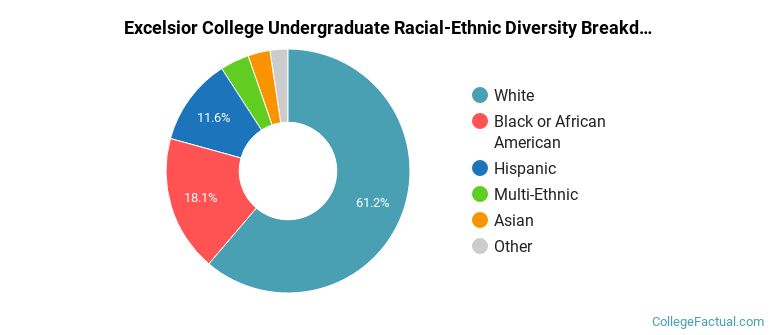
| Race/Ethnicity | Number |
|---|---|
| White | 13,321 |
| Black or African American | 3,853 |
| Hispanic | 2,681 |
| Multi-Ethnic | 822 |
| Asian | 667 |
| International | 212 |
| Unknown | 182 |
| Native Hawaiian or Pacific Islander | 121 |
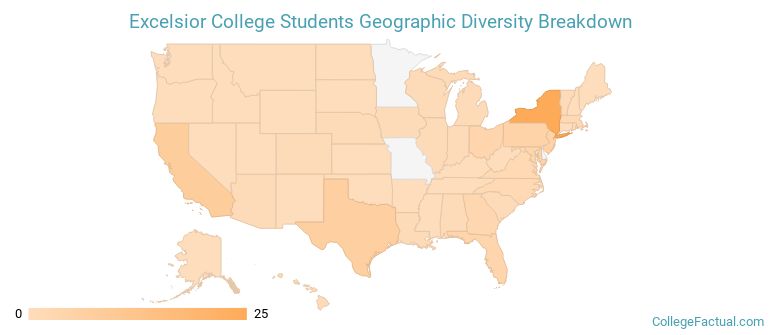
Excelsior College ranks 224 out of 2,183 when it comes to geographic diversity.
71.59% of Excelsior College students come from out of state, and 6.32% come from out of the country.
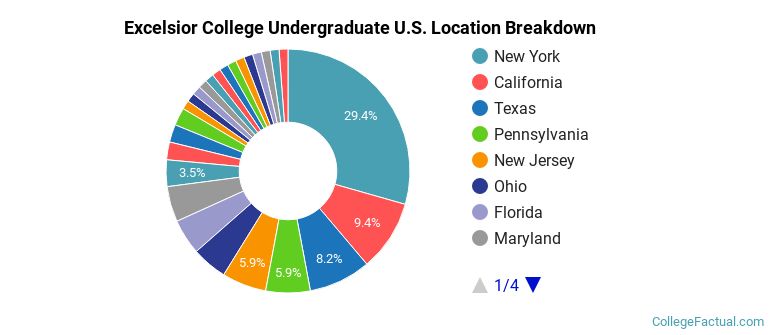
The undergraduate student body is split among 26 states (may include Washington D.C.). Click on the map for more detail.
| State | Amount |
|---|---|
| New York | 25 |
| California | 8 |
| Texas | 7 |
| New Jersey | 5 |
| Pennsylvania | 5 |
A traditional college student is defined as being between the ages of 18-21. At Excelsior College, 5.30% of students fall into that category, compared to the national average of 60%.
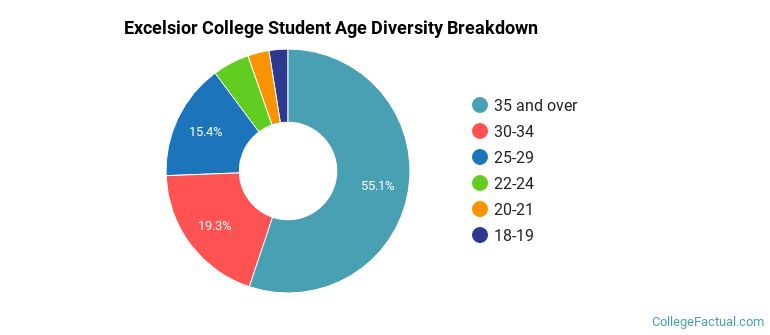
| Student Age Group | Amount |
|---|---|
| 35 and over | 18,632 |
| 30-34 | 6,509 |
| 25-29 | 5,210 |
| 22-24 | 1,645 |
| 20-21 | 954 |
| 18-19 | 848 |
| Under 18 | 0 |
Footnotes
*The racial-ethnic minorities count is calculated by taking the total number of students and subtracting white students, international students, and students whose race/ethnicity was unknown. This number is then divided by the total number of students at the school to obtain the racial-ethnic minorities percentage.
References
Department of Homeland Security Citizenship and Immigration Services
Image Credit: By Snowy Brooklyn College under License
Find out how College Factual created their Diversity Rankings.