Fairfield U total enrollment is approximately 5,513 students. 4,231 are undergraduates and 582 are graduate students.
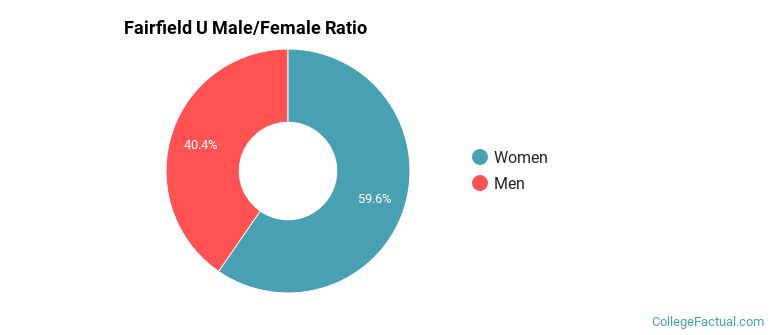
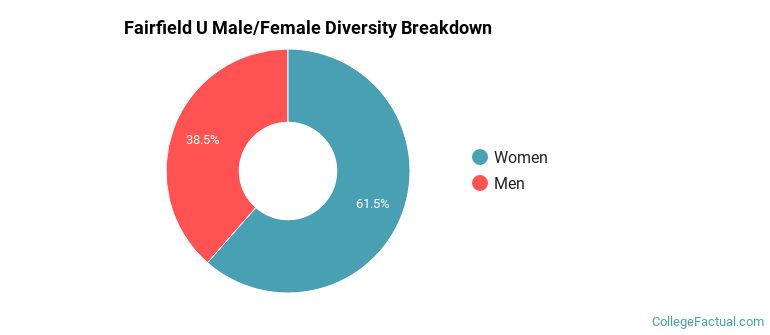
Male/Female Breakdown of Undergraduates
The full-time Fairfield U undergraduate population is made up of 59% women, and 41% men.
For the gender breakdown for all students, go here.
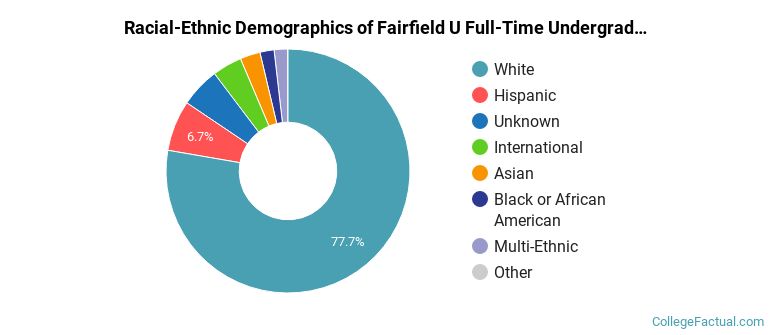
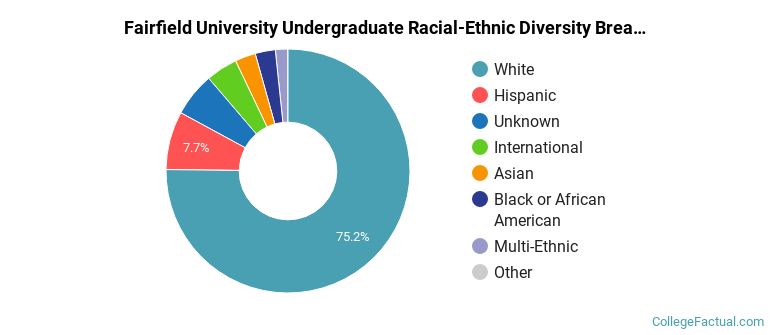
Fairfield U Racial/Ethnic Breakdown of Undergraduates
| Race/Ethnicity | Number |
|---|---|
| White | 3,300 |
| Hispanic | 299 |
| Unknown | 242 |
| International | 130 |
| Asian | 114 |
| Multi-Ethnic | 71 |
| Black or African American | 69 |
| Native Hawaiian or Pacific Islander | 2 |
See racial/ethnic breakdown for all students.
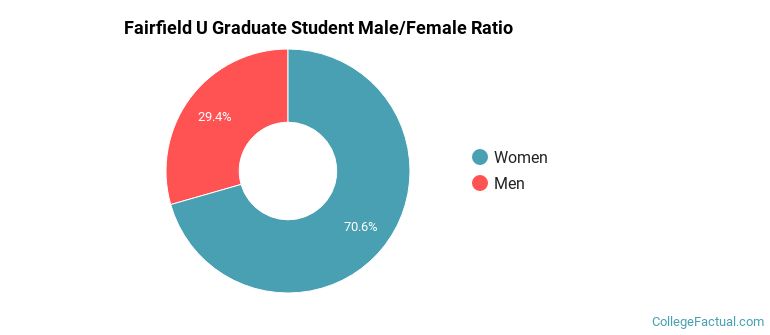
Male/Female Breakdown of Graduate Students
About 66% of full-time grad students are women, and 34% men.
For the gender breakdown for all students, go here.
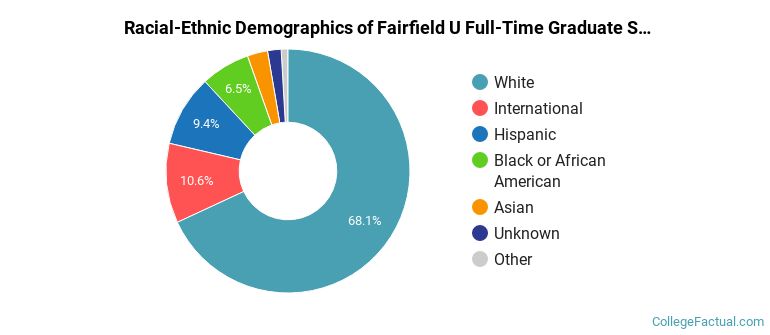
Fairfield U Racial-Ethnic Breakdown of Graduate Students
| Race/Ethnicity | Number |
|---|---|
| White | 365 |
| International | 74 |
| Hispanic | 66 |
| Black or African American | 42 |
| Asian | 16 |
| Multi-Ethnic | 11 |
| Unknown | 8 |
| Native Hawaiian or Pacific Islander | 0 |
See racial/ethnic breakdown for all students.
| Race/Ethnicity | Number |
|---|---|
| White | 4,150 |
| Hispanic | 445 |
| Unknown | 300 |
| International | 224 |
| Asian | 156 |
| Black or African American | 142 |
| Multi-Ethnic | 90 |
| Native Hawaiian or Pacific Islander | 2 |
There are approximately 3,345 female students and 2,168 male students at Fairfield U.
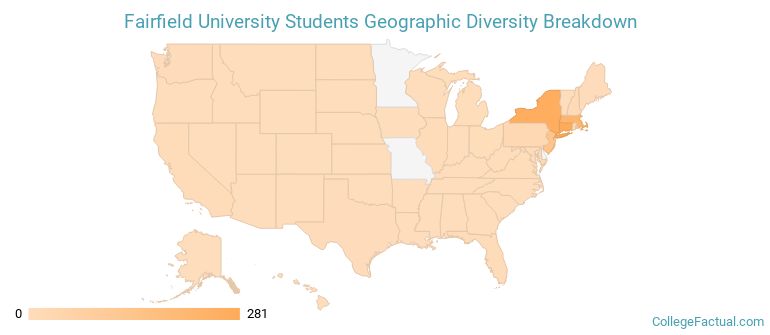
Fairfield U ranks 464 out of 2,183 when it comes to geographic diversity.
72.61% of Fairfield U students come from out of state, and 2.37% come from out of the country.
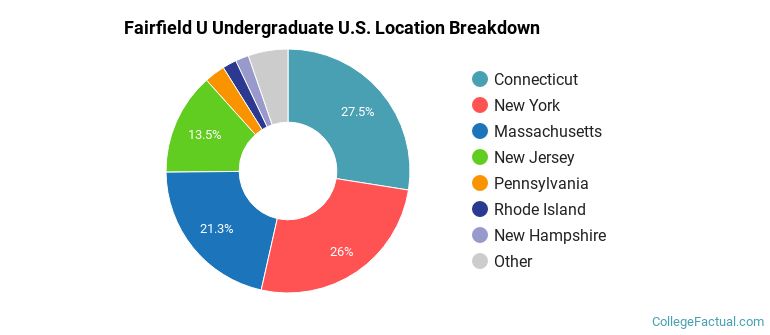
The undergraduate student body is split among 20 states (may include Washington D.C.). Click on the map for more detail.
| State | Amount |
|---|---|
| Connecticut | 281 |
| New York | 266 |
| Massachusetts | 218 |
| New Jersey | 138 |
| Pennsylvania | 28 |
Students from 56 countries are represented at this school, with the majority of the international students coming from India, China, and Vietnam.
Learn more about international students at Fairfield U.
A traditional college student is defined as being between the ages of 18-21. At Fairfield U, 71.15% of students fall into that category, compared to the national average of 60%.
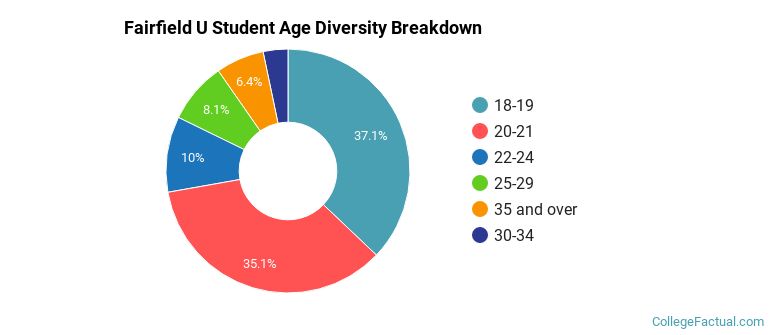
| Student Age Group | Amount |
|---|---|
| 18-19 | 1,898 |
| 20-21 | 1,796 |
| 22-24 | 513 |
| 25-29 | 414 |
| 35 and over | 327 |
| 30-34 | 168 |
| Under 18 | 0 |
Footnotes
*The racial-ethnic minorities count is calculated by taking the total number of students and subtracting white students, international students, and students whose race/ethnicity was unknown. This number is then divided by the total number of students at the school to obtain the racial-ethnic minorities percentage.
References
Department of Homeland Security Citizenship and Immigration Services
Image Credit: By Stagophile under License