FDU total enrollment is approximately 7,479 students. 2,189 are undergraduates and 494 are graduate students.
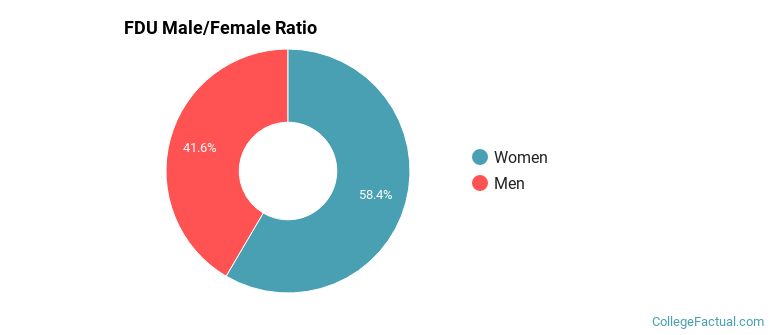
Male/Female Breakdown of Undergraduates
The full-time FDU undergraduate population is made up of 58% women, and 42% men.
For the gender breakdown for all students, go here.
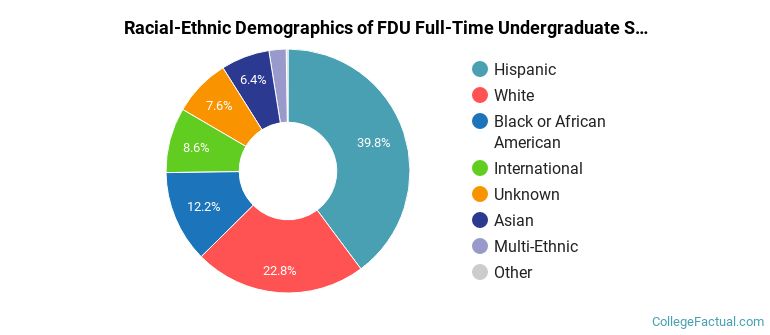
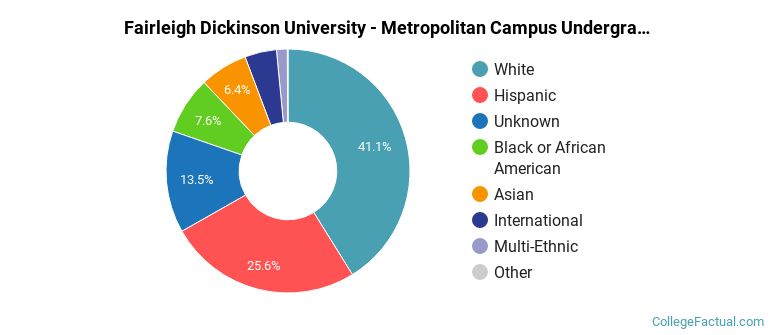
FDU Racial/Ethnic Breakdown of Undergraduates
| Race/Ethnicity | Number |
|---|---|
| Hispanic | 884 |
| White | 510 |
| Black or African American | 270 |
| International | 187 |
| Unknown | 153 |
| Asian | 135 |
| Multi-Ethnic | 42 |
| Native Hawaiian or Pacific Islander | 5 |
See racial/ethnic breakdown for all students.
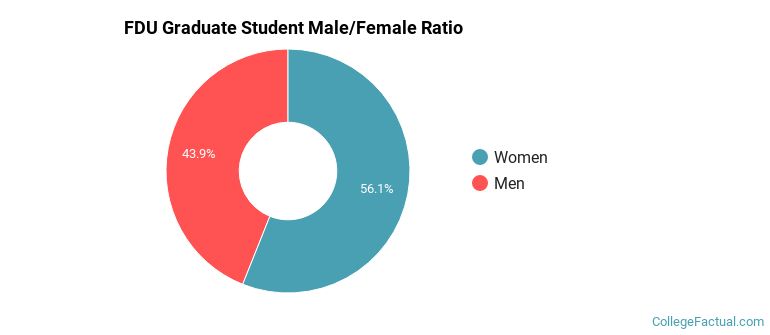
Male/Female Breakdown of Graduate Students
About 59% of full-time grad students are women, and 41% men.
For the gender breakdown for all students, go here.
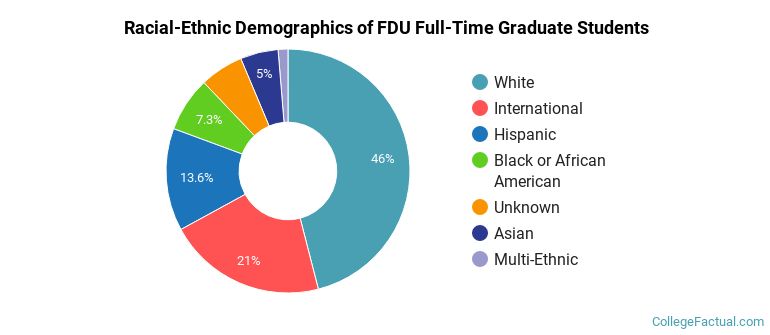
FDU Racial-Ethnic Breakdown of Graduate Students
| Race/Ethnicity | Number |
|---|---|
| White | 200 |
| International | 88 |
| Hispanic | 67 |
| Unknown | 64 |
| Black or African American | 45 |
| Asian | 21 |
| Multi-Ethnic | 9 |
| Native Hawaiian or Pacific Islander | 0 |
See racial/ethnic breakdown for all students.
| Race/Ethnicity | Number |
|---|---|
| White | 3,118 |
| Hispanic | 1,844 |
| Unknown | 1,001 |
| Black or African American | 597 |
| Asian | 462 |
| International | 310 |
| Multi-Ethnic | 112 |
| Native Hawaiian or Pacific Islander | 9 |

There are approximately 4,497 female students and 2,982 male students at FDU.
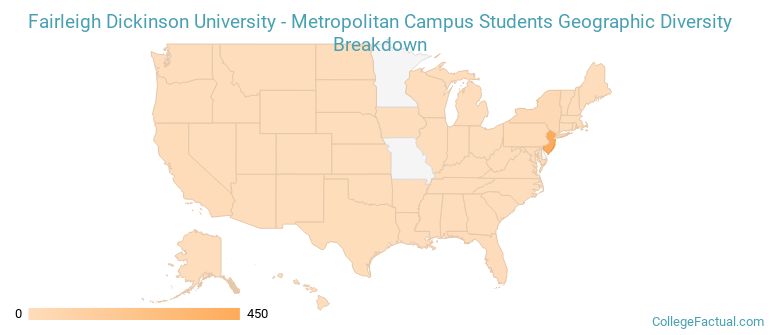
FDU ranks 1,335 out of 2,183 when it comes to geographic diversity.
13.79% of FDU students come from out of state, and 4.22% come from out of the country.
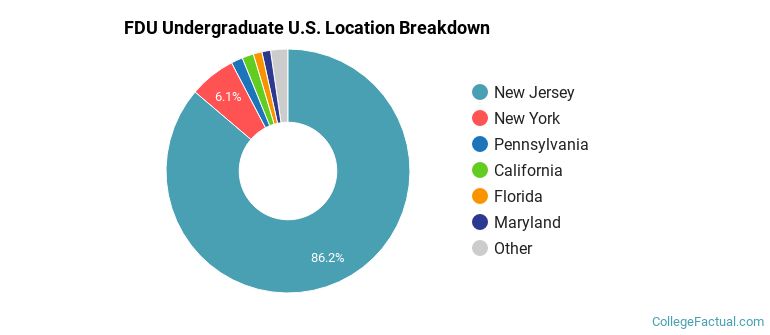
The undergraduate student body is split among 13 states (may include Washington D.C.). Click on the map for more detail.
| State | Amount |
|---|---|
| New Jersey | 450 |
| New York | 32 |
| California | 8 |
| Pennsylvania | 8 |
| Florida | 6 |
Students from 73 countries are represented at this school, with the majority of the international students coming from India, China, and Saudi Arabia.
Learn more about international students at FDU.
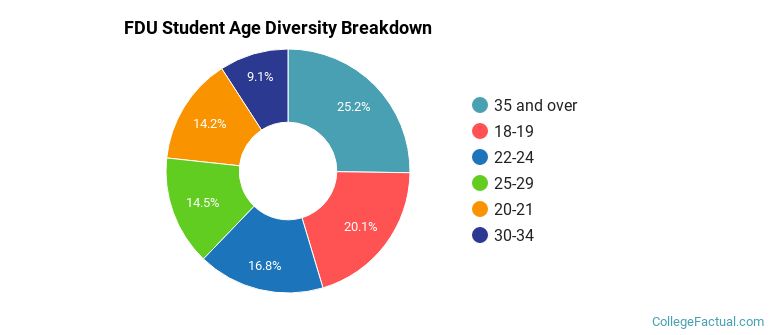
A traditional college student is defined as being between the ages of 18-21. At FDU, 26.50% of students fall into that category, compared to the national average of 60%.
| Student Age Group | Amount |
|---|---|
| 35 and over | 1,529 |
| 18-19 | 1,221 |
| 22-24 | 1,019 |
| 25-29 | 880 |
| 20-21 | 858 |
| 30-34 | 554 |
| Under 18 | 0 |
Footnotes
*The racial-ethnic minorities count is calculated by taking the total number of students and subtracting white students, international students, and students whose race/ethnicity was unknown. This number is then divided by the total number of students at the school to obtain the racial-ethnic minorities percentage.
References
Department of Homeland Security Citizenship and Immigration Services
Image Credit: By Jim.henderson under License
Learn more about how College Factual creates their Diversity Rankings.