Explore the best ranked schools for the programs you are most interested in.
Faith was not ranked in College Factual's Best Overall Colleges report this year. This may be because not enough data was available.
Returning adults and other non-traditional students may appreciate the fact that Faith International University has an open admissions policy. This means that you'll only have to submit basic materials, which may include proof that you completed high school or an equivalent program.
The student to faculty ratio at Faith is an impressive 10 to 1. That's quite good when you compare it to the national average of 15 to 1. This is a good sign that students at the school will have more opportunities for one-on-one interactions with their professors.
Another measure that is often used to estimate how much access students will have to their professors is how many faculty members are full-time. The idea here is that part-time faculty tend to spend less time on campus, so they may not be as available to students as full-timers.
The full-time faculty percentage at Faith International University is 37%. This is lower than the national average of 47%.
The freshmen retention rate tells us what percentage of first-year, full-time students choose to continue on to their sophomore year at a particular school. The rate at Faith International University is 67%, which is about average when compared to the national rate of 68%.
The on-time graduation rate is the percent of first-time, full time students who obtain their bachelor's degree in four years or less. This rate is 17% for first-time, full-time students at Faith, which is lower than the national rate of 33.3%.
Find out more about the retention and graduation rates at Faith International University.
During the 2017-2018 academic year, there were 142 undergraduates at Faith with 86 being full-time and 56 being part-time.
The net price is calculated by adding tuition, room, board and other costs and subtracting financial aid.Note that the net price is typically less than the published for a school. For more information on the sticker price of Faith, see our tuition and fees and room and board pages.
It's not uncommon for college students to take out loans to pay for school. In fact, almost 66% of students nationwide depend at least partially on loans. At Faith, approximately 33% of students took out student loans averaging $2,493 a year. That adds up to $9,972 over four years for those students.
Get more details about paying for Faith International University.
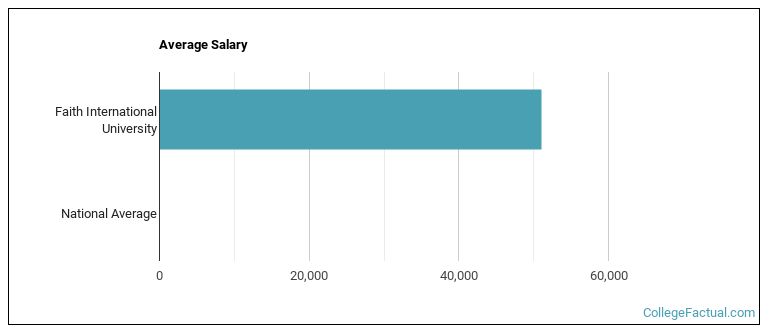
See which majors at Faith International University make the most money.
Get more details about the location of Faith International University.

Contact details for Faith are given below.
| Contact Details | |
|---|---|
| Address: | 3504 N Pearl St, Tacoma, WA 98407-0186 |
| Phone: | 253-752-2020 |
| Website: | https://www.faithiu.edu/ |
| Most Popular Majors | Bachelor’s Degrees | Average Salary of Graduates |
|---|---|---|
| Religious Studies | 18 | $42,103 |
| Business Administration & Management | 15 | NA |
| Theological & Ministerial Studies | 15 | NA |
| Mental & Social Health Services | 7 | NA |
| Human Resource Management | 6 | NA |
| Educational Administration | 5 | NA |
| Religious Education | 5 | NA |
| Theology & Religious Vocations (Other) | 2 | NA |
| Entrepreneurial Studies | 1 | NA |
| General Education | 1 | NA |
Online learning is becoming popular at even the oldest colleges and universities in the United States. Not only are online classes great for returning adults with busy schedules, they are also frequented by a growing number of traditional students.
In 2022-2023, 237 students took at least one online class at Faith International University. This is an increase from the 187 students who took online classes the previous year.
| Year | Took at Least One Online Class | Took All Classes Online |
|---|---|---|
| 2022-2023 | 237 | 169 |
| 2021-2022 | 187 | 126 |
| 2020-2021 | 222 | 176 |
| 2018-2019 | 83 | 24 |
Learn more about online learning at Faith International University.
Footnotes
*The racial-ethnic minorities count is calculated by taking the total number of students and subtracting white students, international students, and students whose race/ethnicity was unknown. This number is then divided by the total number of students at the school to obtain the racial-ethnic minorities percentage.
References
More about our data sources and methodologies.