We've gathered data and other essential information about the program, such as the average salary of graduates, ethnicity of students, how many students graduated in recent times, and more. In addition, we cover how FIT SUNY ranks in comparison to other schools with fine arts programs.
Jump to any of the following sections:
FIT SUNY is in the top 10% of the country for fine arts. More specifically it was ranked #26 out of 465 schools by College Factual. It is also ranked #3 in New York.
During the 2021-2022 academic year, Fashion Institute of Technology handed out 37 bachelor's degrees in fine & studio arts. This is an increase of 32% over the previous year when 28 degrees were handed out.
In 2022, 13 students received their master’s degree in fine arts from FIT SUNY. This makes it the #69 most popular school for fine arts master’s degree candidates in the country.
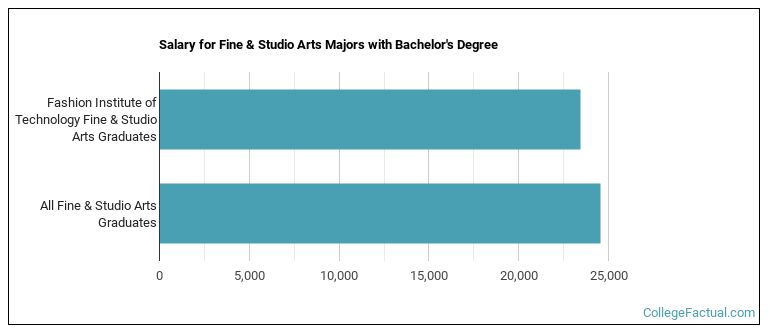
Fine Arts majors who earn their bachelor's degree from FIT SUNY go on to jobs where they make a median salary of $23,428 a year. This is less than $24,539, which is the national median of all fine arts majors in the nation who earn bachelor's degrees.
During the 2022-2023 academic year, part-time undergraduate students at FIT SUNY paid an average of $904 per credit hour if they came to the school from out-of-state. In-state students paid a discounted rate of $299 per credit hour. The following table shows the average full-time tuition and fees for undergraduates.
| In State | Out of State | |
|---|---|---|
| Tuition | $7,170 | $21,692 |
| Fees | $880 | $880 |
| Books and Supplies | $1,850 | $1,850 |
| On Campus Room and Board | $24,623 | $24,623 |
| On Campus Other Expenses | $3,300 | $3,300 |
Learn more about FIT SUNY tuition and fees.
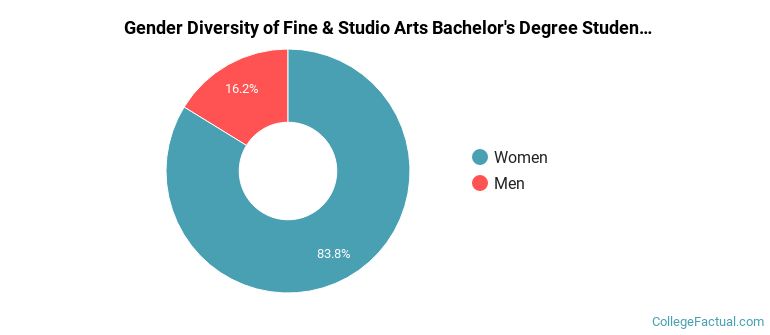
Of the 37 students who earned a bachelor's degree in Fine & Studio Arts from FIT SUNY in 2021-2022, 16% were men and 84% were women.
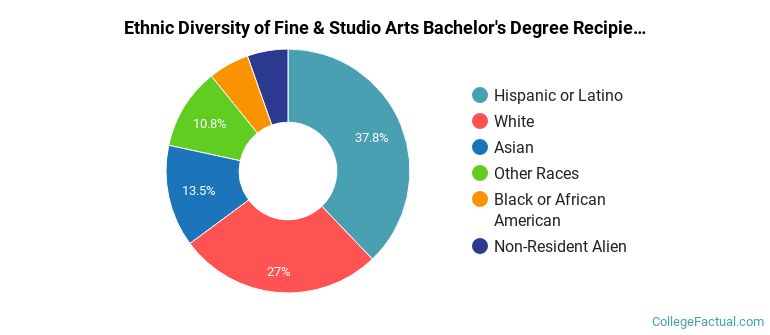
The following table and chart show the ethnic background for students who recently graduated from Fashion Institute of Technology with a bachelor's in fine arts.
| Ethnic Background | Number of Students |
|---|---|
| Asian | 5 |
| Black or African American | 2 |
| Hispanic or Latino | 14 |
| White | 10 |
| Non-Resident Aliens | 2 |
| Other Races | 4 |
Online degrees for the FIT SUNY fine arts bachelor’s degree program are not available at this time. To see if the school offers distance learning options in other areas, visit the FIT SUNY Online Learning page.
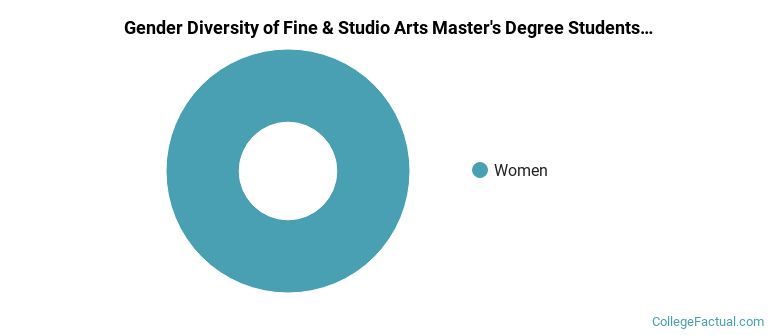
All of the 6 students who graduated with a Master’s in fine arts from FIT SUNY in 2022 were women.
The following table and chart show the ethnic background for students who recently graduated from Fashion Institute of Technology with a master's in fine arts.
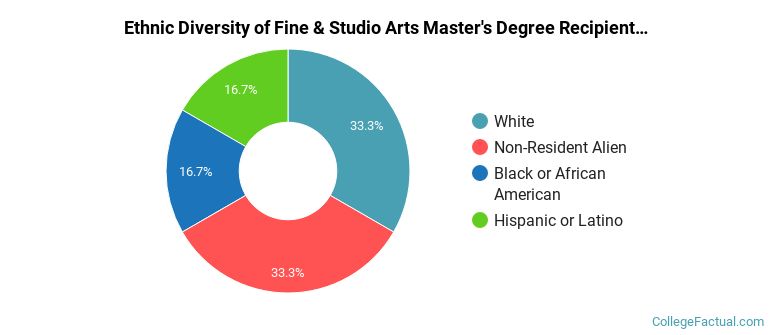
| Ethnic Background | Number of Students |
|---|---|
| Asian | 0 |
| Black or African American | 1 |
| Hispanic or Latino | 1 |
| White | 2 |
| Non-Resident Aliens | 2 |
| Other Races | 0 |
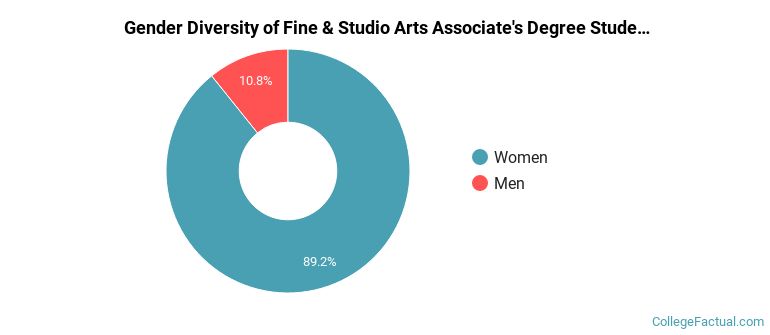
During the 2021-2022 academic year, 65 fine arts majors earned their associate's degree from FIT SUNY. Of these graduates, 11% were men and 89% were women.
The following table and chart show the ethnic background for students who recently graduated from Fashion Institute of Technology with a associate's in fine arts.
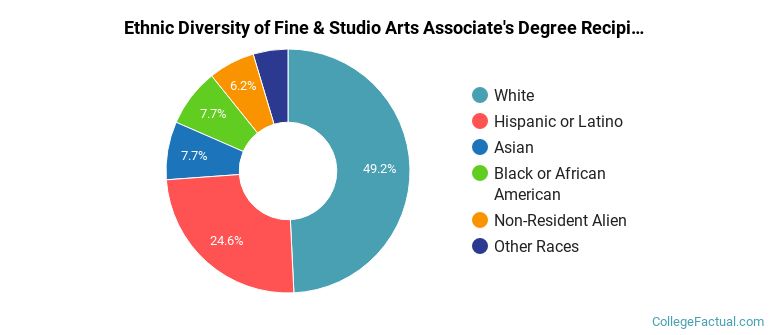
| Ethnic Background | Number of Students |
|---|---|
| Asian | 5 |
| Black or African American | 5 |
| Hispanic or Latino | 16 |
| White | 32 |
| Non-Resident Aliens | 4 |
| Other Races | 3 |
Take a look at the following statistics related to the make-up of the fine arts majors at Fashion Institute of Technology.
| Related Major | Annual Graduates |
|---|---|
| Design & Applied Arts | 1,313 |
| Film, Video & Photographic Arts | 32 |
| Arts & Media Management | 21 |
| General Visual & Performing Arts | 1 |
More about our data sources and methodologies.