Fayetteville State University total enrollment is approximately 6,726 students. 3,959 are undergraduates and 450 are graduate students.
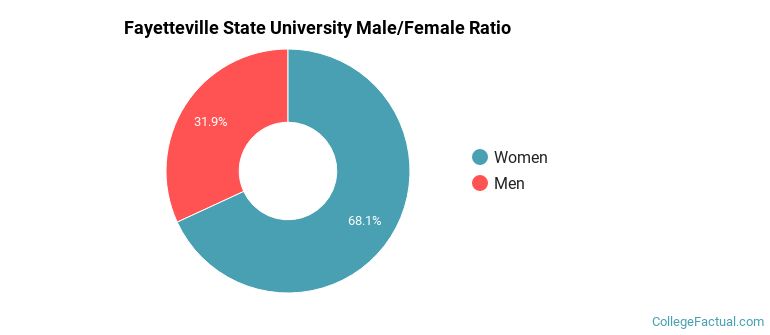
Male/Female Breakdown of Undergraduates
The full-time Fayetteville State University undergraduate population is made up of 71% women, and 29% men.
For the gender breakdown for all students, go here.
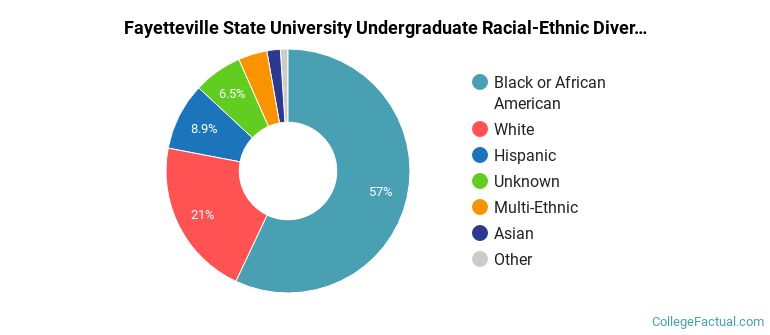
Fayetteville State University Racial/Ethnic Breakdown of Undergraduates

| Race/Ethnicity | Number |
|---|---|
| Black or African American | 2,448 |
| White | 612 |
| Hispanic | 347 |
| Unknown | 211 |
| Multi-Ethnic | 203 |
| Asian | 55 |
| International | 19 |
| Native Hawaiian or Pacific Islander | 7 |
See racial/ethnic breakdown for all students.
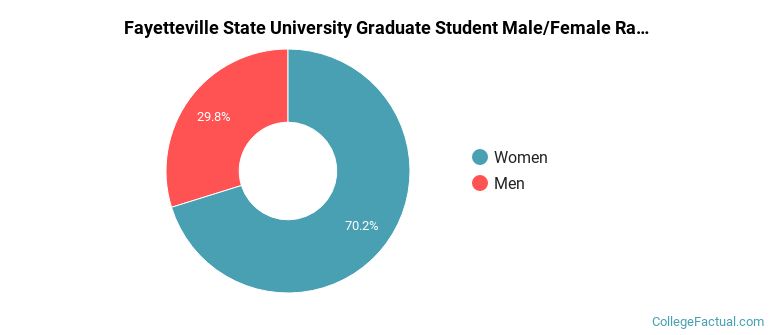
Male/Female Breakdown of Graduate Students
About 71% of full-time grad students are women, and 29% men.
For the gender breakdown for all students, go here.
Fayetteville State University Racial-Ethnic Breakdown of Graduate Students

| Race/Ethnicity | Number |
|---|---|
| Black or African American | 248 |
| White | 109 |
| Hispanic | 36 |
| Unknown | 29 |
| Asian | 8 |
| Multi-Ethnic | 8 |
| International | 4 |
| Native Hawaiian or Pacific Islander | 3 |
See racial/ethnic breakdown for all students.
| Race/Ethnicity | Number |
|---|---|
| Black or African American | 3,796 |
| White | 1,377 |
| Hispanic | 580 |
| Unknown | 374 |
| Multi-Ethnic | 304 |
| Asian | 122 |
| International | 47 |
| Native Hawaiian or Pacific Islander | 23 |

There are approximately 4,721 female students and 2,005 male students at Fayetteville State University.
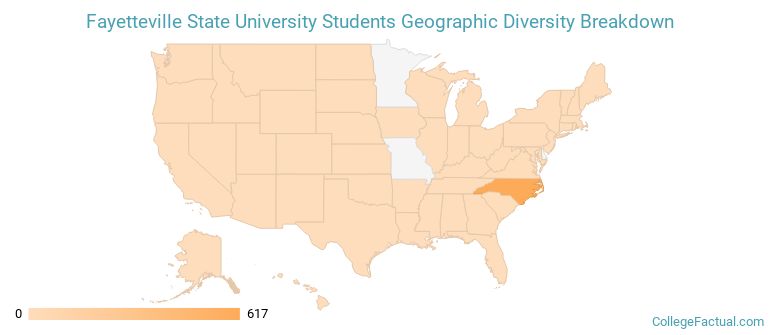
Fayetteville State University ranks 1,751 out of 2,183 when it comes to geographic diversity.
4.64% of Fayetteville State University students come from out of state, and 0% come from out of the country.
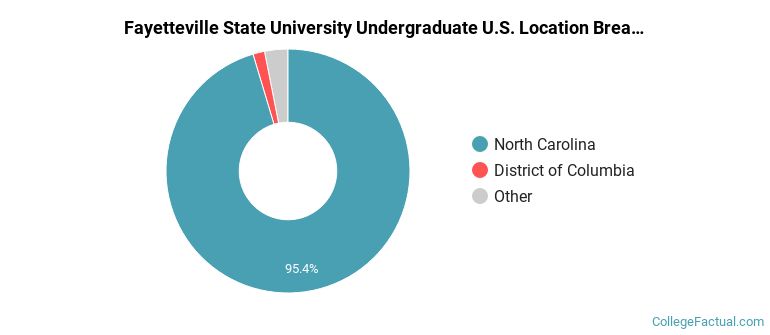
The undergraduate student body is split among 11 states (may include Washington D.C.). Click on the map for more detail.
| State | Amount |
|---|---|
| North Carolina | 617 |
| District of Columbia | 10 |
| South Carolina | 6 |
| Maryland | 4 |
| Virginia | 4 |
Students from 9 countries are represented at this school, with the majority of the international students coming from China, Nigeria, and India.
Learn more about international students at Fayetteville State University.
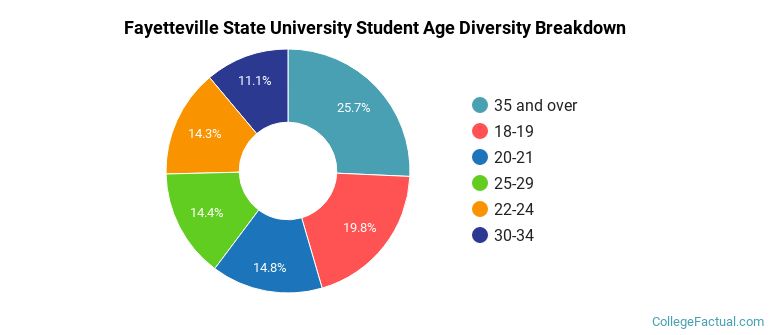
A traditional college student is defined as being between the ages of 18-21. At Fayetteville State University, 31.38% of students fall into that category, compared to the national average of 60%.
| Student Age Group | Amount |
|---|---|
| 35 and over | 1,455 |
| 18-19 | 1,119 |
| 20-21 | 835 |
| 25-29 | 813 |
| 22-24 | 808 |
| 30-34 | 629 |
| Under 18 | 0 |
Footnotes
*The racial-ethnic minorities count is calculated by taking the total number of students and subtracting white students, international students, and students whose race/ethnicity was unknown. This number is then divided by the total number of students at the school to obtain the racial-ethnic minorities percentage.
References
Department of Homeland Security Citizenship and Immigration Services
Image Credit: By Staff Sgt. Greg Thomas under License