Ferris total enrollment is approximately 11,165 students. 7,127 are undergraduates and 804 are graduate students.
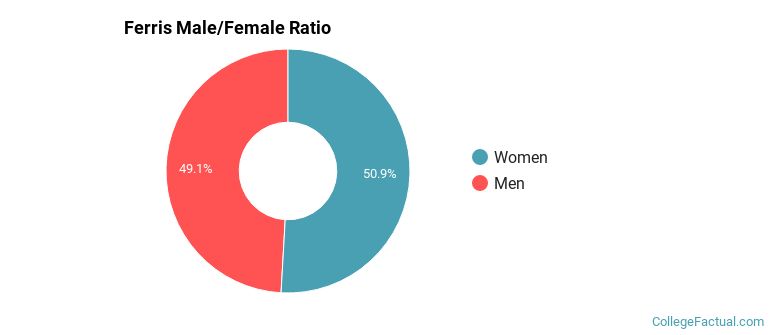
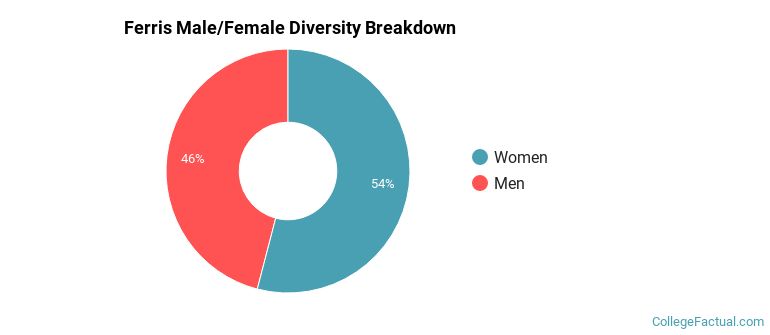
Male/Female Breakdown of Undergraduates
The full-time Ferris undergraduate population is made up of 52% women, and 48% men.
For the gender breakdown for all students, go here.
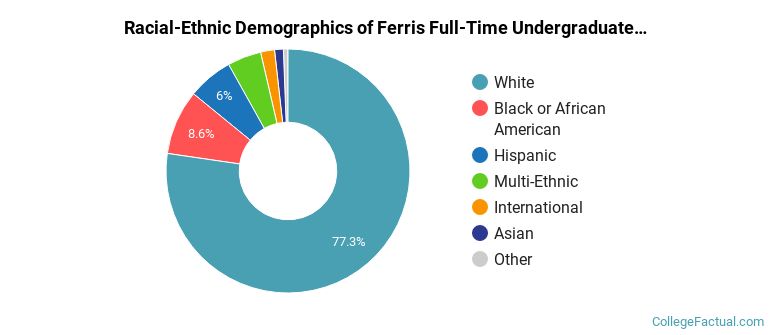
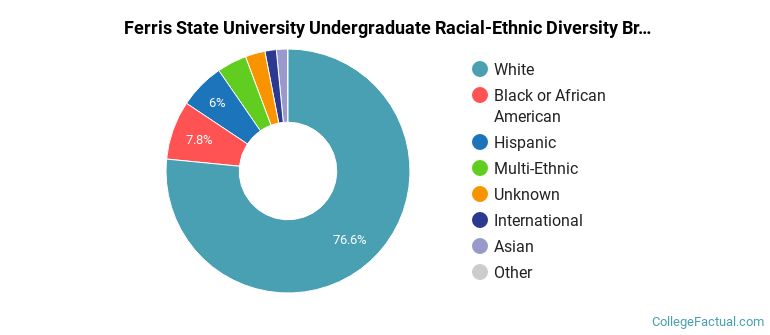
Ferris Racial/Ethnic Breakdown of Undergraduates
| Race/Ethnicity | Number |
|---|---|
| White | 5,527 |
| Black or African American | 607 |
| Hispanic | 412 |
| Multi-Ethnic | 319 |
| Asian | 92 |
| International | 92 |
| Unknown | 44 |
| Native Hawaiian or Pacific Islander | 2 |
See racial/ethnic breakdown for all students.
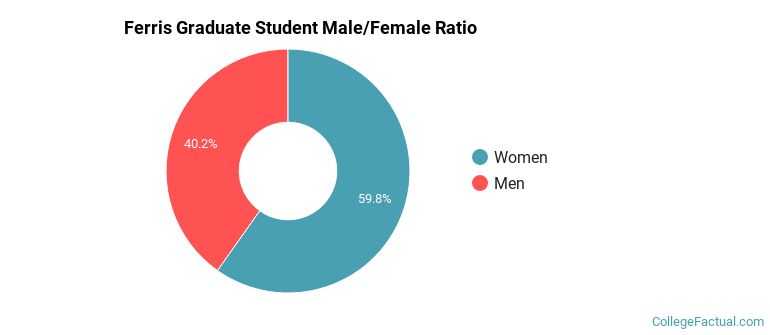
Male/Female Breakdown of Graduate Students
About 61% of full-time grad students are women, and 39% men.
For the gender breakdown for all students, go here.
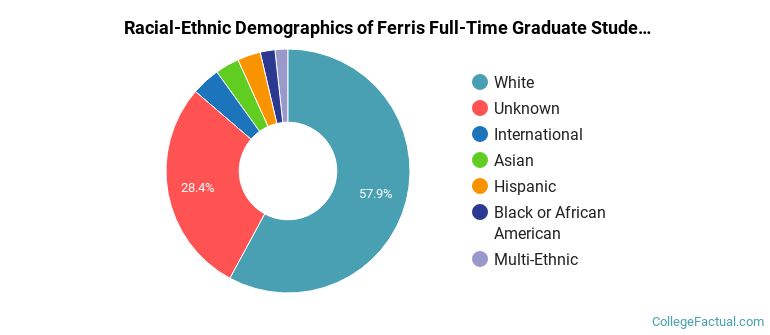
Ferris Racial-Ethnic Breakdown of Graduate Students
| Race/Ethnicity | Number |
|---|---|
| White | 466 |
| Unknown | 226 |
| Hispanic | 32 |
| Asian | 27 |
| International | 26 |
| Multi-Ethnic | 14 |
| Black or African American | 9 |
| Native Hawaiian or Pacific Islander | 0 |
See racial/ethnic breakdown for all students.
| Race/Ethnicity | Number |
|---|---|
| White | 8,469 |
| Black or African American | 918 |
| Hispanic | 650 |
| Multi-Ethnic | 434 |
| Unknown | 314 |
| Asian | 180 |
| International | 135 |
| Native Hawaiian or Pacific Islander | 4 |
There are approximately 6,041 female students and 5,124 male students at Ferris.
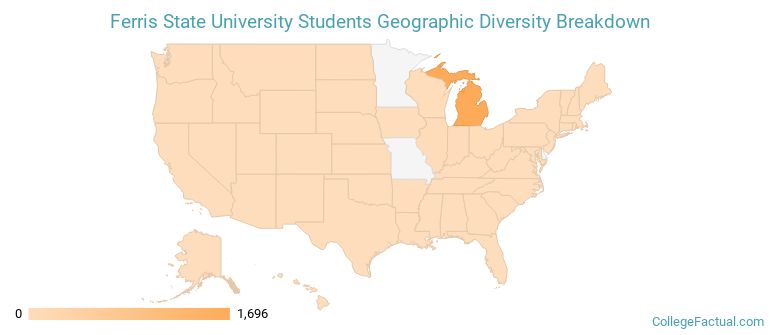
Ferris ranks 1,528 out of 2,183 when it comes to geographic diversity.
6.04% of Ferris students come from out of state, and 0.92% come from out of the country.
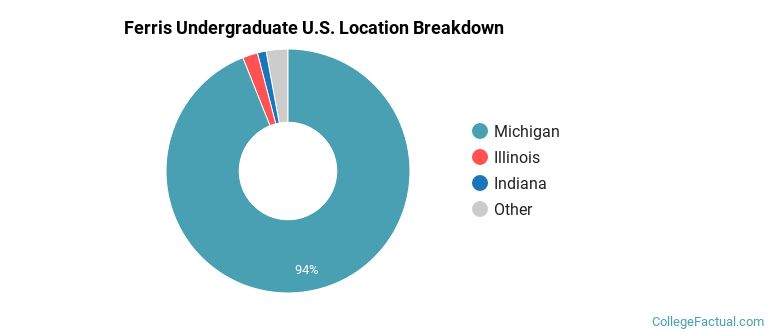
The undergraduate student body is split among 17 states (may include Washington D.C.). Click on the map for more detail.
| State | Amount |
|---|---|
| Michigan | 1,696 |
| Illinois | 36 |
| Indiana | 21 |
| Wisconsin | 16 |
| Ohio | 9 |
Students from 48 countries are represented at this school, with the majority of the international students coming from Saudi Arabia, India, and China.
Learn more about international students at Ferris.
A traditional college student is defined as being between the ages of 18-21. At Ferris, 47.25% of students fall into that category, compared to the national average of 60%.
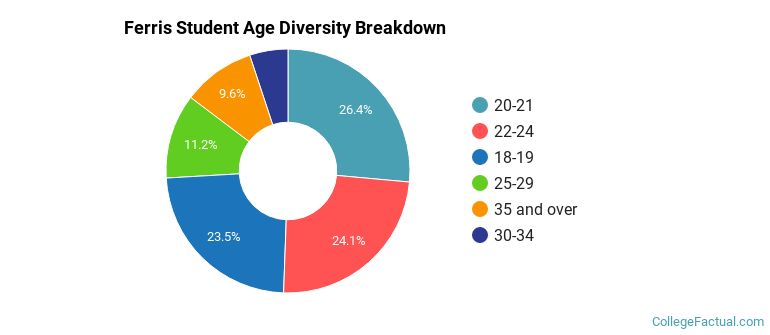
| Student Age Group | Amount |
|---|---|
| 20-21 | 3,452 |
| 22-24 | 3,150 |
| 18-19 | 3,068 |
| 25-29 | 1,464 |
| 35 and over | 1,256 |
| 30-34 | 664 |
| Under 18 | 0 |
Footnotes
*The racial-ethnic minorities count is calculated by taking the total number of students and subtracting white students, international students, and students whose race/ethnicity was unknown. This number is then divided by the total number of students at the school to obtain the racial-ethnic minorities percentage.
References
Department of Homeland Security Citizenship and Immigration Services
Image Credit: By Michael Barera under License
Find out how College Factual created their Diversity Rankings.