Fitchburg State total enrollment is approximately 6,728 students. 2,831 are undergraduates and 518 are graduate students.
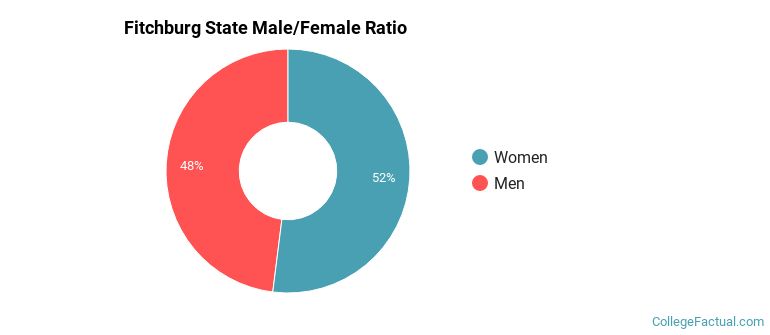
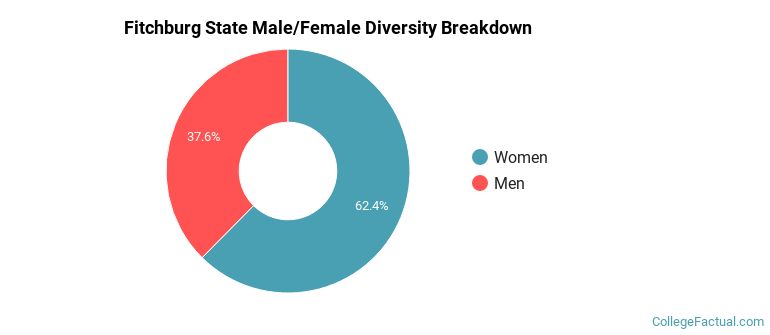
Male/Female Breakdown of Undergraduates
The full-time Fitchburg State undergraduate population is made up of 53% women, and 47% men.
For the gender breakdown for all students, go here.
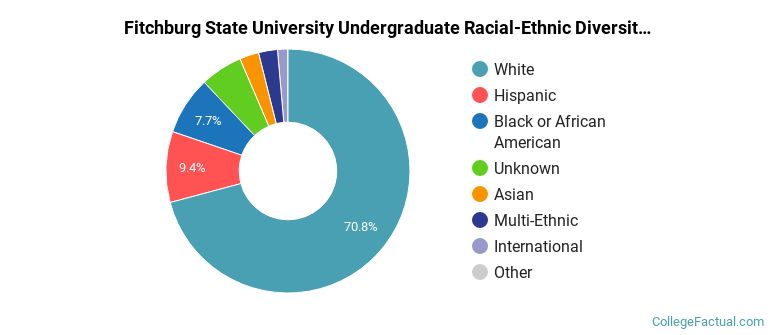
Fitchburg State Racial/Ethnic Breakdown of Undergraduates
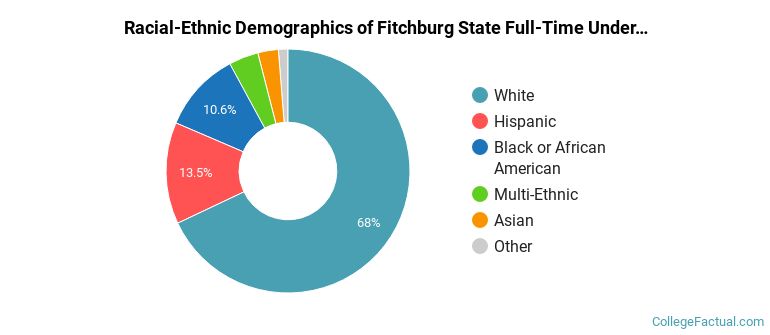
| Race/Ethnicity | Number |
|---|---|
| White | 1,879 |
| Hispanic | 406 |
| Black or African American | 322 |
| Multi-Ethnic | 83 |
| Asian | 82 |
| Unknown | 39 |
| International | 15 |
| Native Hawaiian or Pacific Islander | 0 |
See racial/ethnic breakdown for all students.
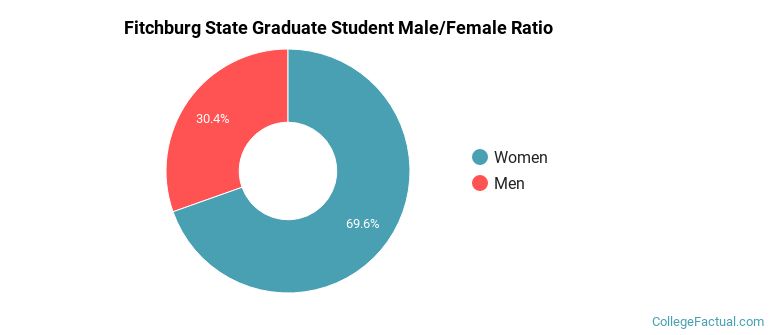
Male/Female Breakdown of Graduate Students
About 66% of full-time grad students are women, and 34% men.
For the gender breakdown for all students, go here.
Fitchburg State Racial-Ethnic Breakdown of Graduate Students
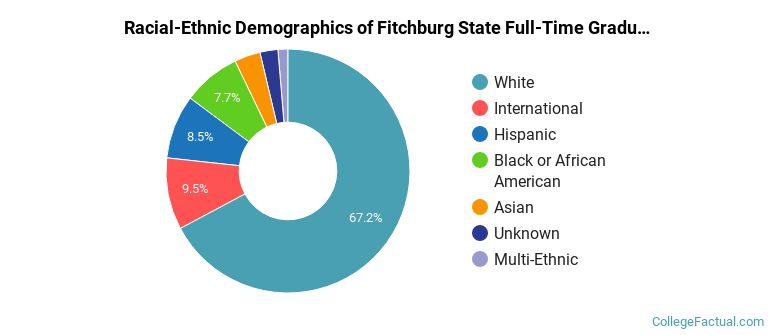
| Race/Ethnicity | Number |
|---|---|
| White | 357 |
| Black or African American | 56 |
| Hispanic | 37 |
| International | 30 |
| Asian | 16 |
| Multi-Ethnic | 12 |
| Unknown | 7 |
| Native Hawaiian or Pacific Islander | 2 |
See racial/ethnic breakdown for all students.
| Race/Ethnicity | Number |
|---|---|
| White | 4,735 |
| Hispanic | 689 |
| Black or African American | 635 |
| Asian | 203 |
| Unknown | 181 |
| Multi-Ethnic | 150 |
| International | 122 |
| Native Hawaiian or Pacific Islander | 4 |
There are approximately 4,091 female students and 2,637 male students at Fitchburg State.
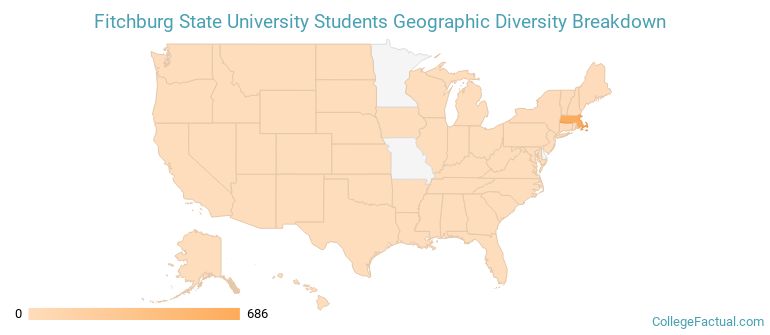
Fitchburg State ranks 1,563 out of 2,183 when it comes to geographic diversity.
9.74% of Fitchburg State students come from out of state, and 0.26% come from out of the country.
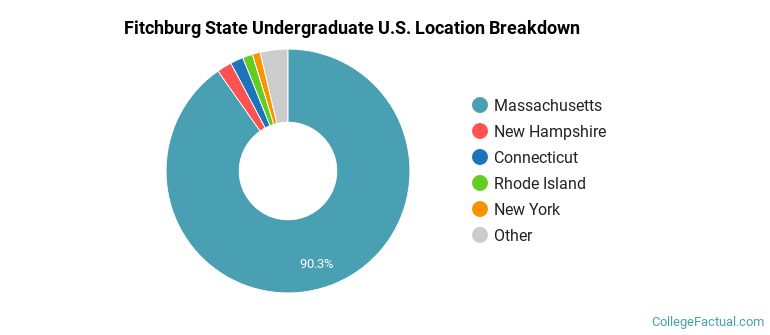
The undergraduate student body is split among 16 states (may include Washington D.C.). Click on the map for more detail.
| State | Amount |
|---|---|
| Massachusetts | 686 |
| New Hampshire | 15 |
| Connecticut | 13 |
| Rhode Island | 10 |
| New York | 8 |
Students from 28 countries are represented at this school, with the majority of the international students coming from India, China, and Germany.
Learn more about international students at Fitchburg State.
A traditional college student is defined as being between the ages of 18-21. At Fitchburg State, 36.08% of students fall into that category, compared to the national average of 60%.
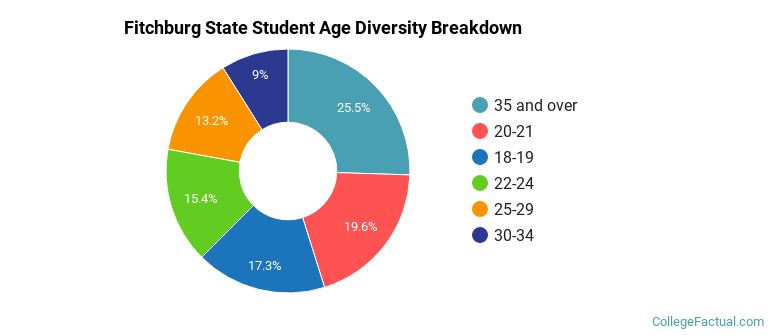
| Student Age Group | Amount |
|---|---|
| 35 and over | 1,761 |
| 20-21 | 1,356 |
| 18-19 | 1,197 |
| 22-24 | 1,060 |
| 25-29 | 911 |
| 30-34 | 618 |
| Under 18 | 0 |
Footnotes
*The racial-ethnic minorities count is calculated by taking the total number of students and subtracting white students, international students, and students whose race/ethnicity was unknown. This number is then divided by the total number of students at the school to obtain the racial-ethnic minorities percentage.
References
Department of Homeland Security Citizenship and Immigration Services
Image Credit: By Found5dollar under License
Read College Factual's Diversity Ranking Methodology.