Florence-Darlington Technical College total enrollment is approximately 3,315 students.
Male/Female Breakdown of Undergraduates
The full-time Florence-Darlington Technical College undergraduate population is made up of 58% women, and 42% men.
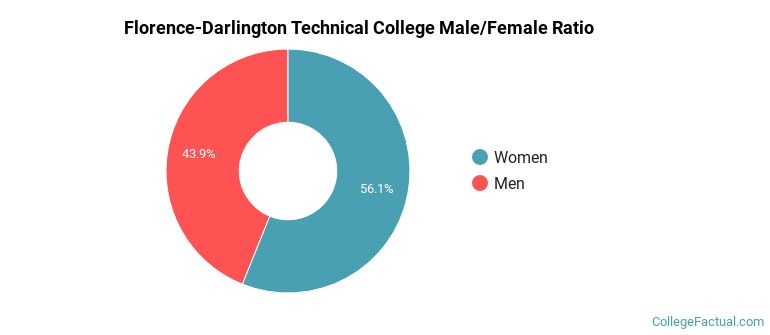
For the gender breakdown for all students, go here.
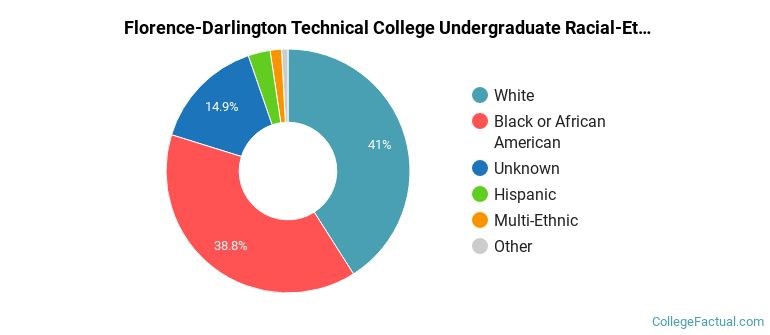
Florence-Darlington Technical College Racial/Ethnic Breakdown of Undergraduates
| Race/Ethnicity | Number |
|---|---|
| White | 567 |
| Black or African American | 333 |
| Unknown | 293 |
| Hispanic | 25 |
| Multi-Ethnic | 16 |
| Asian | 8 |
| International | 2 |
| Native Hawaiian or Pacific Islander | 0 |
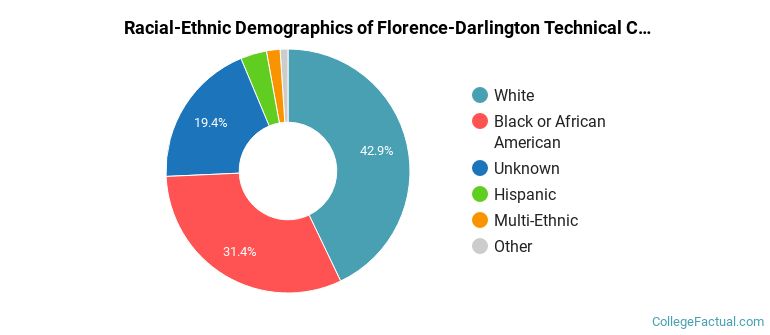
See racial/ethnic breakdown for all students.
| Race/Ethnicity | Number |
|---|---|
| White | 1,393 |
| Black or African American | 1,195 |
| Unknown | 547 |
| Hispanic | 66 |
| Multi-Ethnic | 46 |
| Asian | 33 |
| International | 3 |
| Native Hawaiian or Pacific Islander | 1 |
There are approximately 2,207 female students and 1,108 male students at Florence-Darlington Technical College.
Students from 3 countries are represented at this school, with the majority of the international students coming from South Korea, Mexico, and India.
Learn more about international students at Florence-Darlington Technical College.
A traditional college student is defined as being between the ages of 18-21. At Florence-Darlington Technical College, 36.16% of students fall into that category, compared to the national average of 60%.
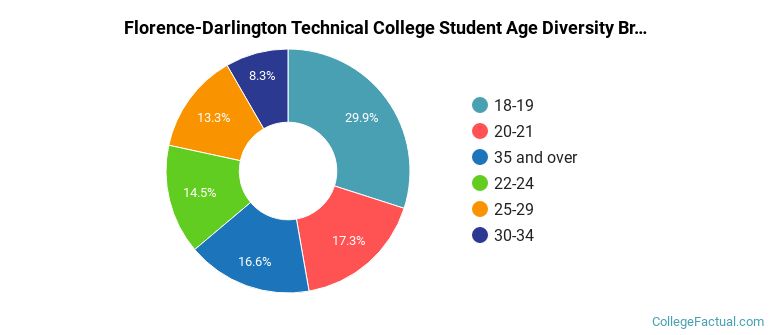
| Student Age Group | Amount |
|---|---|
| 18-19 | 1,247 |
| 20-21 | 720 |
| 35 and over | 692 |
| 22-24 | 605 |
| 25-29 | 553 |
| 30-34 | 347 |
| Under 18 | 0 |
Footnotes
*The racial-ethnic minorities count is calculated by taking the total number of students and subtracting white students, international students, and students whose race/ethnicity was unknown. This number is then divided by the total number of students at the school to obtain the racial-ethnic minorities percentage.
References