Here, you'll find out more about the major, including such details as the number of graduates, what degree levels are offered, ethnicity of students, and more. In addition, we cover how Florida A&M University ranks in comparison to other schools with architecture programs.
Jump to any of the following sections:
The architecture major at Florida A&M University is not ranked on College Factual’s Best Colleges and Universities for General Architecture. This could be for a number of reasons, such as not having enough data on the major or school to make an accurate assessment of its quality.
During the 2021-2022 academic year, Florida Agricultural and Mechanical University handed out 38 bachelor's degrees in general architecture. This is an increase of 9% over the previous year when 35 degrees were handed out.
In 2022, 15 students received their master’s degree in architecture from Florida A&M University. This makes it the #22 most popular school for architecture master’s degree candidates in the country.
In 2022-2023, the average part-time undergraduate tuition at Florida A&M University was $586 per credit hour for out-of-state students. The average for in-state students was $188 per credit hour. The following table shows the average full-time tuition and fees for undergraduates.
| In State | Out of State | |
|---|---|---|
| Tuition | $3,152 | $14,524 |
| Fees | $2,633 | $3,201 |
| Books and Supplies | $1,138 | $1,138 |
| On Campus Room and Board | $11,644 | $11,644 |
| On Campus Other Expenses | $5,586 | $5,586 |
Learn more about Florida A&M University tuition and fees.
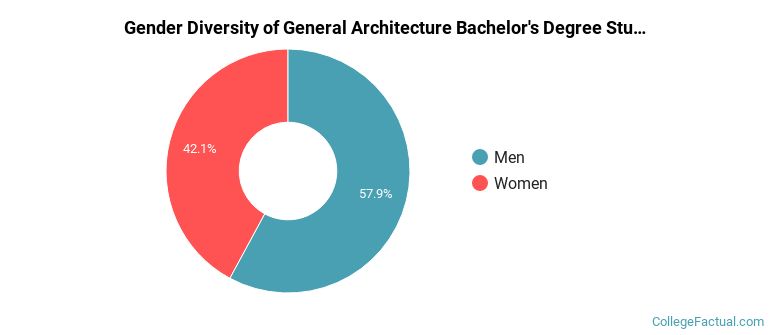
The architecture program at Florida A&M University awarded 38 bachelor's degrees in 2021-2022. About 58% of these degrees went to men with the other 42% going to women.
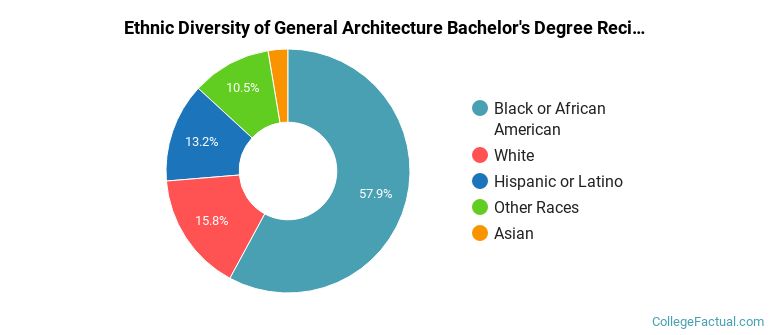
The majority of the bachelor's degree graduates for this major are black or African Americans. About 58% of grads fell into this category.
The following table and chart show the ethnic background for students who recently graduated from Florida Agricultural and Mechanical University with a bachelor's in architecture.
| Ethnic Background | Number of Students |
|---|---|
| Asian | 1 |
| Black or African American | 22 |
| Hispanic or Latino | 5 |
| White | 6 |
| Non-Resident Aliens | 0 |
| Other Races | 4 |
Florida A&M University does not offer an online option for its architecture bachelor’s degree program at this time. To see if the school offers distance learning options in other areas, visit the Florida A&M University Online Learning page.
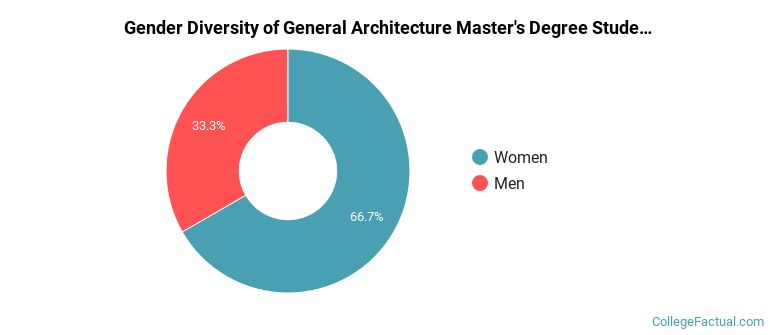
In the 2021-2022 academic year, 9 students earned a master's degree in architecture from Florida A&M University. About 67% of these graduates were women and the other 33% were men.
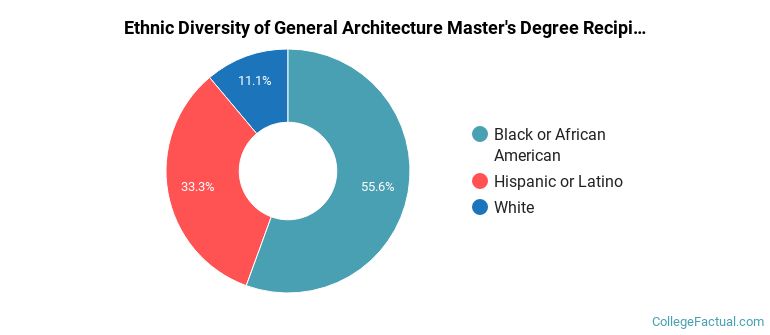
The majority of the master's degree graduates for this major are black or African Americans. About 56% of grads fell into this category.
The following table and chart show the ethnic background for students who recently graduated from Florida Agricultural and Mechanical University with a master's in architecture.
| Ethnic Background | Number of Students |
|---|---|
| Asian | 0 |
| Black or African American | 5 |
| Hispanic or Latino | 3 |
| White | 1 |
| Non-Resident Aliens | 0 |
| Other Races | 0 |
Take a look at the following statistics related to the make-up of the architecture majors at Florida Agricultural and Mechanical University.
More about our data sources and methodologies.