Florida A&M University total enrollment is approximately 9,184 students. 6,244 are undergraduates and 1,491 are graduate students.
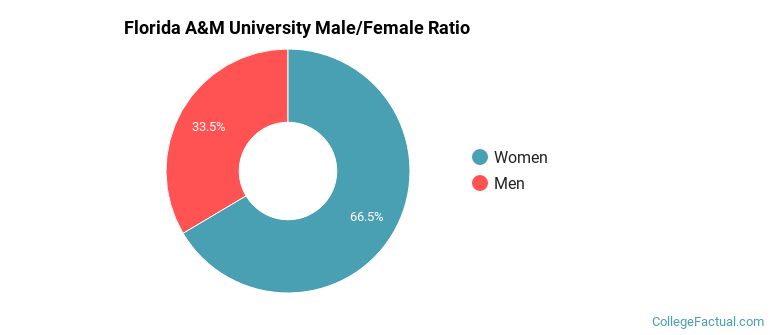
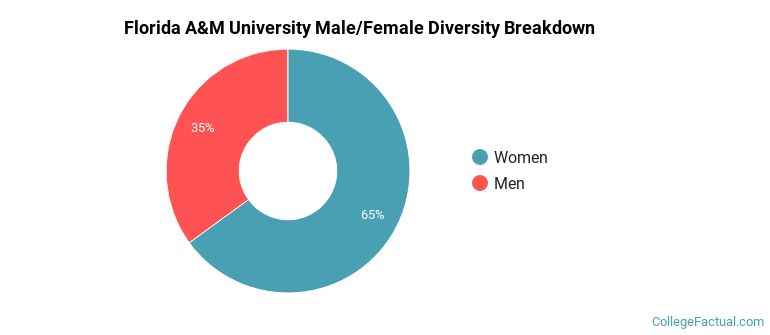
Male/Female Breakdown of Undergraduates
The full-time Florida A&M University undergraduate population is made up of 66% women, and 34% men.
For the gender breakdown for all students, go here.
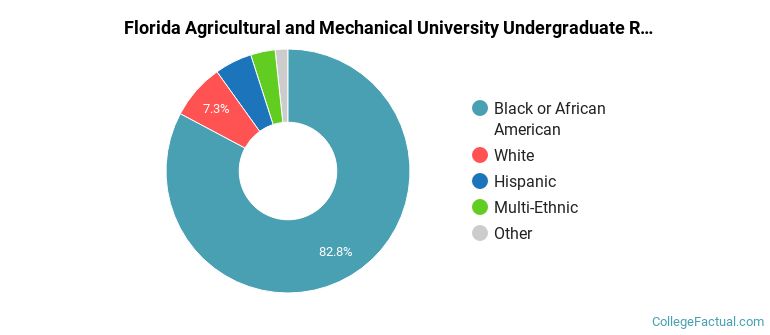
Florida A&M University Racial/Ethnic Breakdown of Undergraduates
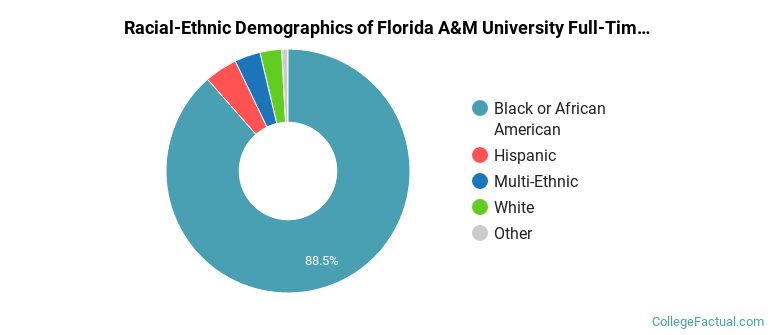
| Race/Ethnicity | Number |
|---|---|
| Black or African American | 5,524 |
| Hispanic | 308 |
| Multi-Ethnic | 187 |
| White | 171 |
| Asian | 27 |
| International | 23 |
| Native Hawaiian or Pacific Islander | 0 |
| Unknown | 0 |
See racial/ethnic breakdown for all students.
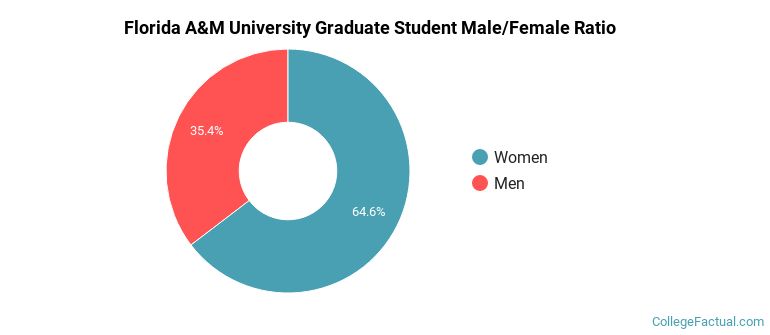
Male/Female Breakdown of Graduate Students
About 67% of full-time grad students are women, and 33% men.
For the gender breakdown for all students, go here.
Florida A&M University Racial-Ethnic Breakdown of Graduate Students
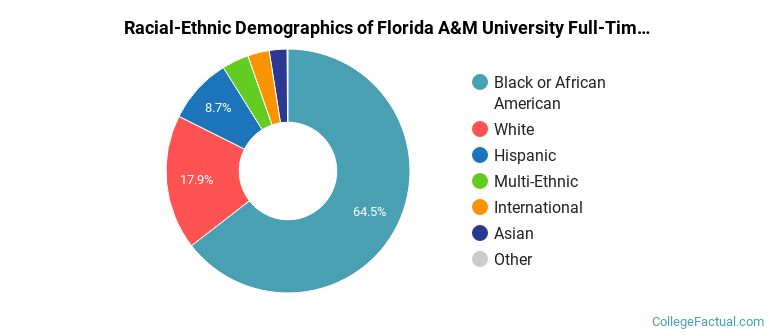
| Race/Ethnicity | Number |
|---|---|
| Black or African American | 1,005 |
| White | 216 |
| Hispanic | 137 |
| International | 54 |
| Multi-Ethnic | 53 |
| Asian | 25 |
| Native Hawaiian or Pacific Islander | 1 |
| Unknown | 0 |
See racial/ethnic breakdown for all students.
| Race/Ethnicity | Number |
|---|---|
| Black or African American | 7,617 |
| White | 624 |
| Hispanic | 511 |
| Multi-Ethnic | 268 |
| International | 84 |
| Asian | 71 |
| Native Hawaiian or Pacific Islander | 5 |
| Unknown | 0 |
There are approximately 6,021 female students and 3,163 male students at Florida A&M University.
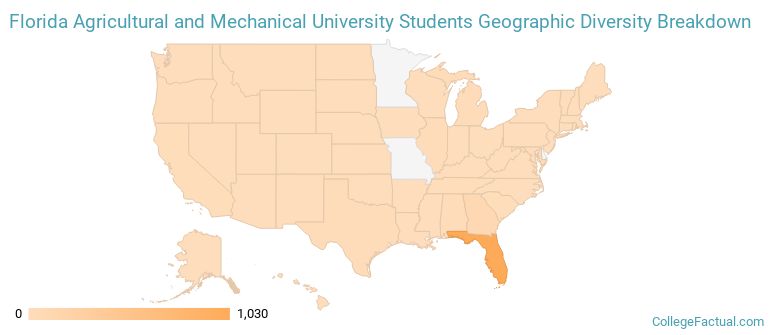
Florida A&M University ranks 818 out of 2,183 when it comes to geographic diversity.
20.09% of Florida A&M University students come from out of state, and 2.56% come from out of the country.
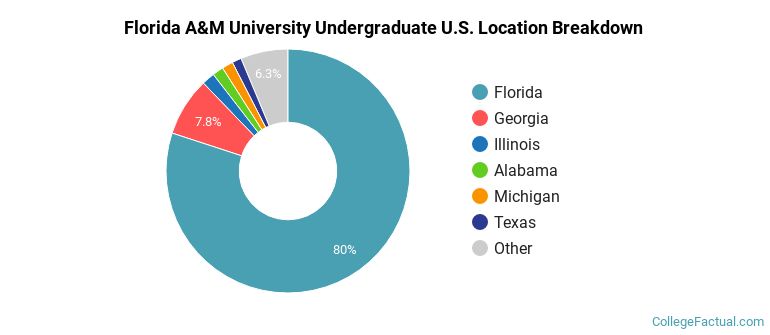
The undergraduate student body is split among 27 states (may include Washington D.C.). Click on the map for more detail.
| State | Amount |
|---|---|
| Florida | 1,030 |
| Georgia | 100 |
| Illinois | 22 |
| Alabama | 19 |
| Michigan | 19 |
Students from 41 countries are represented at this school, with the majority of the international students coming from Bahamas, Nigeria, and Jamaica.
Learn more about international students at Florida A&M University.
A traditional college student is defined as being between the ages of 18-21. At Florida A&M University, 53.88% of students fall into that category, compared to the national average of 60%.
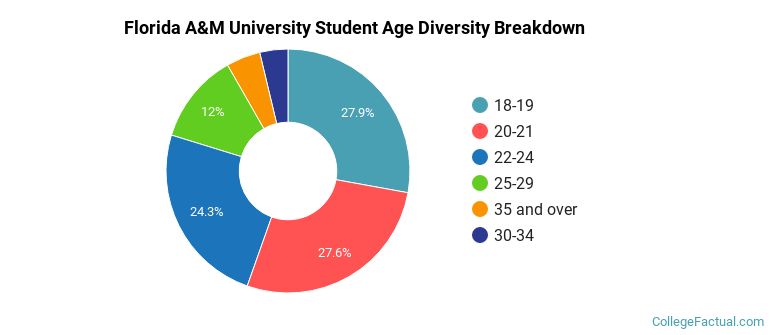
| Student Age Group | Amount |
|---|---|
| 18-19 | 2,684 |
| 20-21 | 2,657 |
| 22-24 | 2,345 |
| 25-29 | 1,155 |
| 35 and over | 436 |
| 30-34 | 360 |
| Under 18 | 0 |
Footnotes
*The racial-ethnic minorities count is calculated by taking the total number of students and subtracting white students, international students, and students whose race/ethnicity was unknown. This number is then divided by the total number of students at the school to obtain the racial-ethnic minorities percentage.
References