FAU total enrollment is approximately 30,805 students. 16,617 are undergraduates and 2,275 are graduate students.
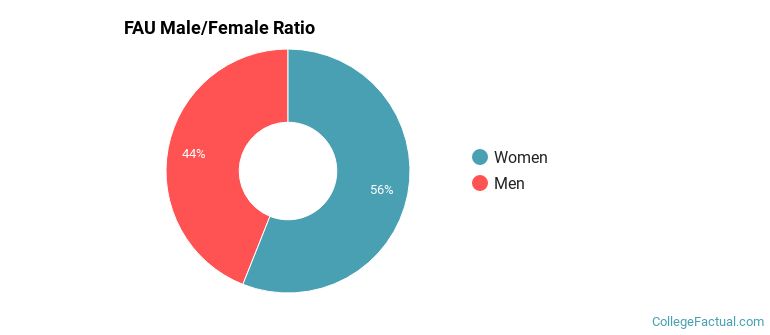
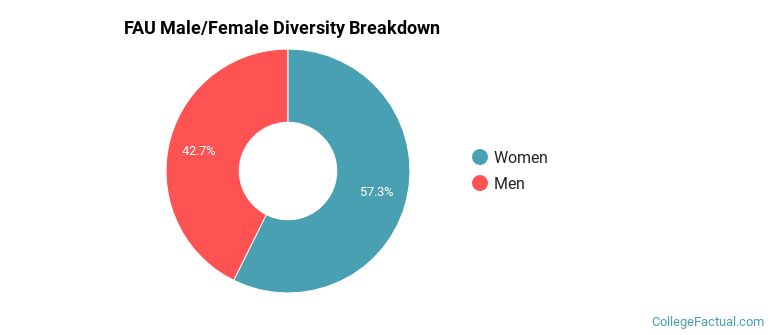
Male/Female Breakdown of Undergraduates
The full-time FAU undergraduate population is made up of 58% women, and 42% men.
For the gender breakdown for all students, go here.
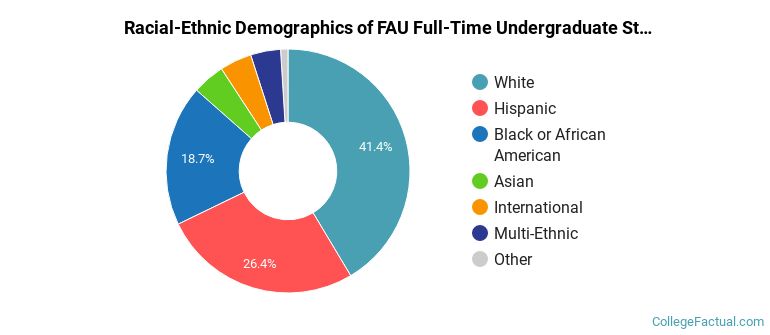
FAU Racial/Ethnic Breakdown of Undergraduates
| Race/Ethnicity | Number |
|---|---|
| White | 6,788 |
| Hispanic | 4,527 |
| Black or African American | 3,157 |
| Asian | 727 |
| Multi-Ethnic | 653 |
| International | 583 |
| Unknown | 138 |
| Native Hawaiian or Pacific Islander | 21 |
See racial/ethnic breakdown for all students.
Male/Female Breakdown of Graduate Students
About 60% of full-time grad students are women, and 40% men.

For the gender breakdown for all students, go here.
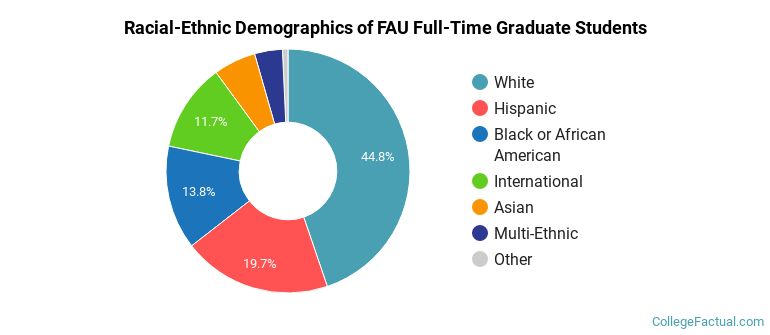
FAU Racial-Ethnic Breakdown of Graduate Students
| Race/Ethnicity | Number |
|---|---|
| White | 1,003 |
| Hispanic | 471 |
| Black or African American | 358 |
| International | 241 |
| Asian | 120 |
| Multi-Ethnic | 66 |
| Unknown | 15 |
| Native Hawaiian or Pacific Islander | 0 |
See racial/ethnic breakdown for all students.
| Race/Ethnicity | Number |
|---|---|
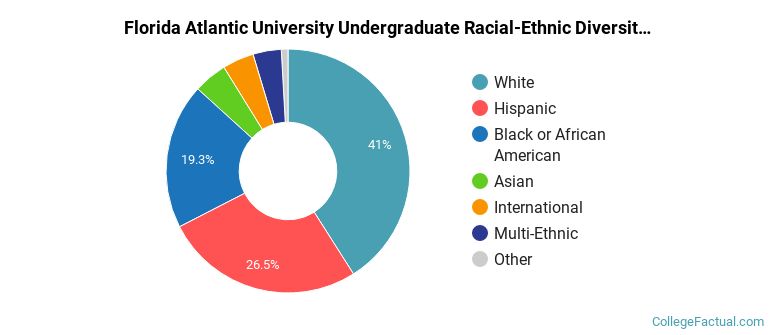
| White | 12,355 |
| Hispanic | 8,424 |
| Black or African American | 6,067 |
| Asian | 1,325 |
| International | 1,163 |
| Multi-Ethnic | 1,155 |
| Unknown | 240 |
| Native Hawaiian or Pacific Islander | 37 |
There are approximately 18,199 female students and 12,606 male students at FAU.
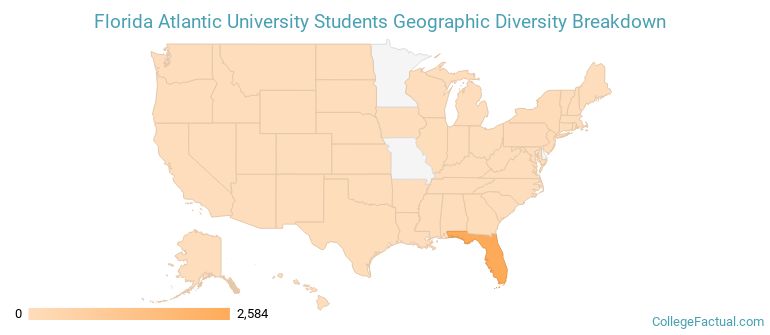
FAU ranks 769 out of 2,183 when it comes to geographic diversity.
11.78% of FAU students come from out of state, and 7.61% come from out of the country.
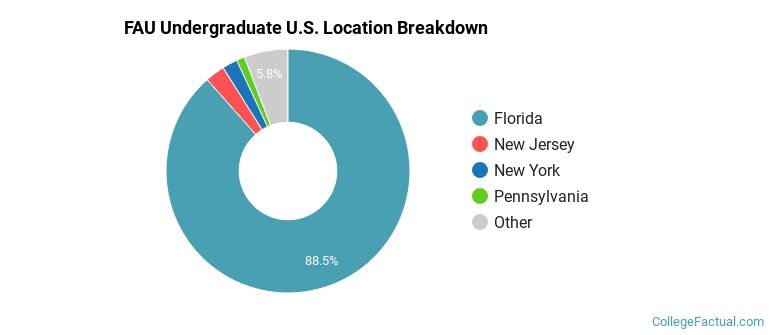
The undergraduate student body is split among 33 states (may include Washington D.C.). Click on the map for more detail.
| State | Amount |
|---|---|
| Florida | 2,584 |
| New Jersey | 76 |
| New York | 59 |
| Pennsylvania | 32 |
| Georgia | 17 |
Students from 114 countries are represented at this school, with the majority of the international students coming from India, China, and Brazil.
Learn more about international students at FAU.
A traditional college student is defined as being between the ages of 18-21. At FAU, 41.41% of students fall into that category, compared to the national average of 60%.
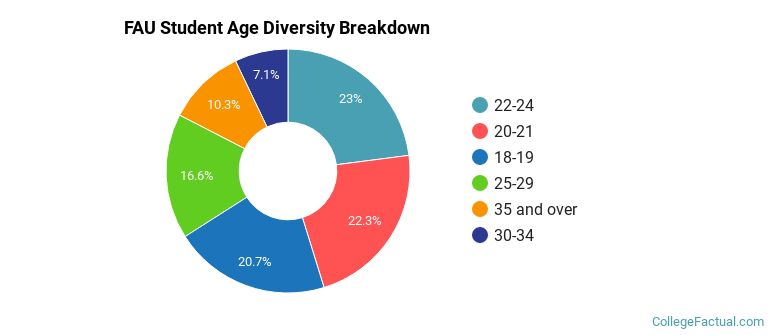
| Student Age Group | Amount |
|---|---|
| 22-24 | 6,676 |
| 20-21 | 6,476 |
| 18-19 | 6,033 |
| 25-29 | 4,830 |
| 35 and over | 3,009 |
| 30-34 | 2,060 |
| Under 18 | 0 |
Footnotes
*The racial-ethnic minorities count is calculated by taking the total number of students and subtracting white students, international students, and students whose race/ethnicity was unknown. This number is then divided by the total number of students at the school to obtain the racial-ethnic minorities percentage.
References
Department of Homeland Security Citizenship and Immigration Services
Image Credit: By Kmgcoolguy4 under License
Learn more about how College Factual creates their Diversity Rankings.