Here, you'll find out more about the major, including such details as the number of graduates, what degree levels are offered, ethnicity of students, average salaries, and more. Also, learn how FGCU ranks among other schools offering degrees in finance.
Jump to any of the following sections:
The bachelor's program at FGCU was ranked #249 on College Factual's Best Schools for finance list. It is also ranked #11 in Florida.
| Ranking Type | Rank |
|---|---|
| Best Finance & Financial Management Bachelor’s Degree Schools | 225 |
| Best Finance & Financial Management Schools | 249 |
During the 2021-2022 academic year, Florida Gulf Coast University handed out 113 bachelor's degrees in finance & financial management. This is a decrease of 5% over the previous year when 119 degrees were handed out.
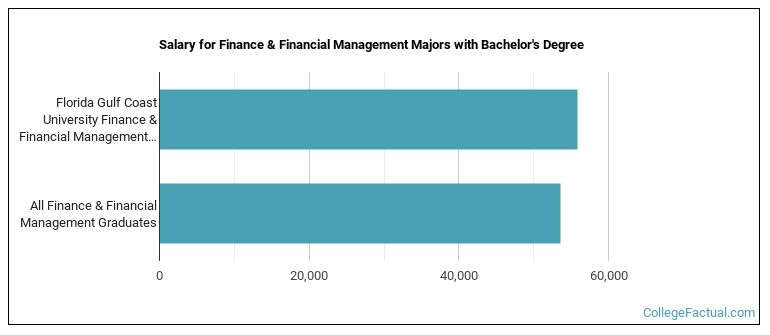
Finance majors who earn their bachelor's degree from FGCU go on to jobs where they make a median salary of $55,882 a year. This is great news for graduates of the program, since this figure is higher than the national average of $53,649 for all finance bachelor's degree recipients.
Learn about other programs related to Finance & Financial Management that might interest you.
Managing and quantifying money is at the heart of the online bachelor's degree in finance at SNHU. You'll learn the fundamentals of investments, address key managerial issues, examine ethics from every angle and build the skillset to be a player in the multidimensional business marketplace.
Prepare to advance your current career in finance with Southern New Hampshire University's online Master's in Finance degree program.
During the 2022-2023 academic year, part-time undergraduate students at FGCU paid an average of $744 per credit hour if they came to the school from out-of-state. In-state students paid a discounted rate of $140 per credit hour. The following table shows the average full-time tuition and fees for undergraduates.
| In State | Out of State | |
|---|---|---|
| Tuition | $4,191 | $22,328 |
| Fees | $1,927 | $2,834 |
| Books and Supplies | $1,200 | $1,200 |
| On Campus Room and Board | $10,914 | $10,914 |
| On Campus Other Expenses | $5,500 | $5,500 |
Learn more about FGCU tuition and fees.
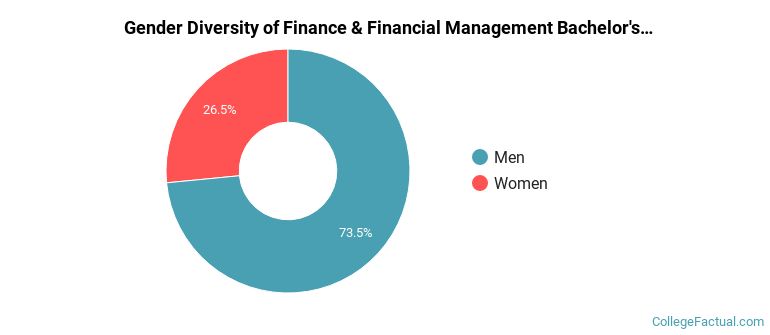
During the 2021-2022 academic year, 113 finance majors earned their bachelor's degree from FGCU. Of these graduates, 73% were men and 27% were women.
The majority of the students with this major are white. About 60% of 2022 graduates were in this category.
The following table and chart show the ethnic background for students who recently graduated from Florida Gulf Coast University with a bachelor's in finance.
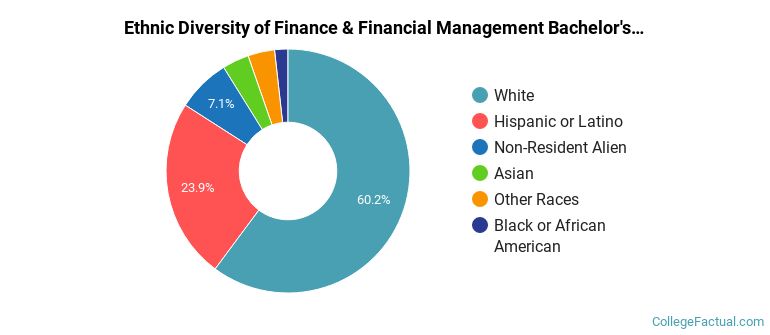
| Ethnic Background | Number of Students |
|---|---|
| Asian | 4 |
| Black or African American | 2 |
| Hispanic or Latino | 27 |
| White | 68 |
| Non-Resident Aliens | 8 |
| Other Races | 4 |
Online degrees for the FGCU finance bachelor’s degree program are not available at this time. To see if the school offers distance learning options in other areas, visit the FGCU Online Learning page.
Take a look at the following statistics related to the make-up of the finance majors at Florida Gulf Coast University.
| Related Major | Annual Graduates |
|---|---|
| Business Administration & Management | 355 |
| Marketing | 109 |
| Hospitality Management | 105 |
| Accounting | 80 |
| Management Information Systems | 74 |
More about our data sources and methodologies.
