
College Factual analyzes over 2,000 colleges and universities in its annual rankings and ranks them in a variety of ways, including most diverse, best overall quality, best for non-traditional students, and much more.
Franklin and Marshall College was awarded 4 badges in the 2025 rankings. The highest ranked major at the school is general business administration and management.
Explore the best ranked schools for the programs you are most interested in.
According to College Factual's 2025 analysis, Franklin and Marshall is ranked #334 out of 2,152 schools in the nation that were analyzed for overall quality. This puts it in the top 20% of all schools in the nation. This is an improvement over the previous year, when Franklin and Marshall held the #573 spot on the Best Overall Colleges list.
Franklin and Marshall is also ranked #18 out of 103 schools in Pennsylvania.
Franklin and Marshall College has an acceptance rate of 36%, which means the school is serious about who it admits. Take your time in putting together a strong application that highlights why you are a good fit for Franklin and Marshall.
About 28% of students accepted to Franklin and Marshall submitted their SAT scores. When looking at the 25th through the 75th percentile, SAT Evidence-Based Reading and Writing scores ranged between 650 and 710. Math scores were between 660 and 730.
The student to faculty ratio at Franklin and Marshall is an impressive 9 to 1. That's quite good when you compare it to the national average of 15 to 1. This is a good sign that students at the school will have more opportunities for one-on-one interactions with their professors.
Another measure that is often used to estimate how much access students will have to their professors is how many faculty members are full-time. The idea here is that part-time faculty tend to spend less time on campus, so they may not be as available to students as full-timers.
The full-time faculty percentage at Franklin and Marshall College is 83%. This is higher than the national average of 47%.
The freshmen retention rate of 88% tells us that most first-year, full-time students like Franklin and Marshall College enough to come back for another year. This is a fair bit higher than the national average of 68%. That's certainly something to check off in the good column about the school.
Students are considered to have graduated on time if they finish their studies within four years. At Franklin and Marshall the on-time graduation rate of first-time, full-time students is 81%. That is great when compared to the national average of 33.3%
Find out more about the retention and graduation rates at Franklin and Marshall College.
During the 2017-2018 academic year, there were 2,254 undergraduates at Franklin and Marshall with 2,236 being full-time and 18 being part-time.
| $0-30 K | $30K-48K | $48-75 | $75-110K | $110K + |
|---|---|---|---|---|
| $16,051 | $8,514 | $17,660 | $28,761 | $48,305 |
The net price is calculated by adding tuition, room, board and other costs and subtracting financial aid.Note that the net price is typically less than the published for a school. For more information on the sticker price of Franklin and Marshall, see our tuition and fees and room and board pages.
It's not uncommon for college students to take out loans to pay for school. In fact, almost 66% of students nationwide depend at least partially on loans. At Franklin and Marshall, approximately 54% of students took out student loans averaging $8,059 a year. That adds up to $32,236 over four years for those students.
Get more details about paying for Franklin and Marshall College.
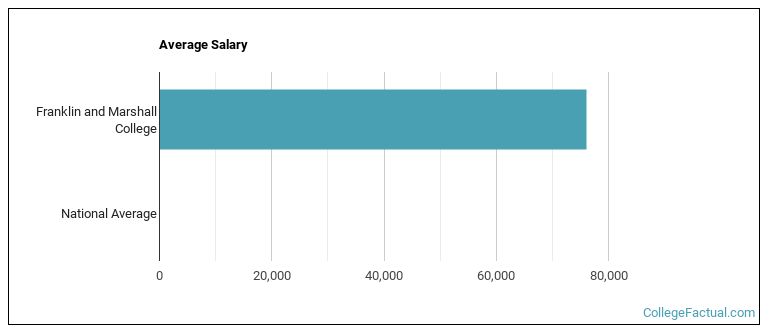
See which majors at Franklin and Marshall College make the most money.
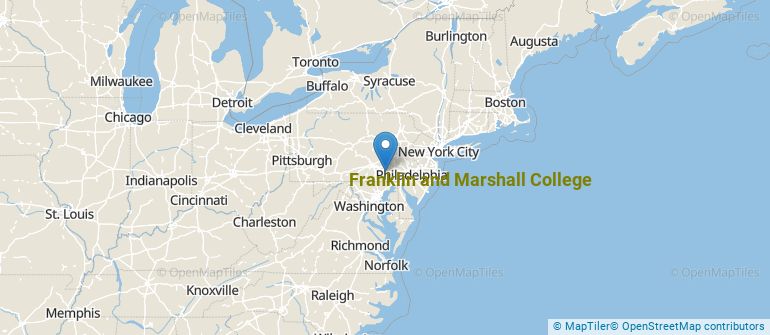
Get more details about the location of Franklin and Marshall College.
Contact details for Franklin and Marshall are given below.
| Contact Details | |
|---|---|
| Address: | College Ave, Lancaster, PA 17604-3003 |
| Phone: | 717-358-3911 |
| Website: | www.fandm.edu/ |
| Most Popular Majors | Bachelor’s Degrees | Average Salary of Graduates |
|---|---|---|
| Other Multi/Interdisciplinary Studies | 82 | $43,593 |
| Business Administration & Management | 60 | $64,664 |
| Political Science & Government | 55 | $45,928 |
| Economics | 46 | $52,801 |
| Behavioral Science | 41 | $38,391 |
| Public Health | 38 | $43,134 |
| General Biology | 34 | $37,950 |
| Mathematics | 29 | NA |
| Sociology | 25 | $31,444 |
| Biochemistry, Biophysics & Molecular Biology | 20 | NA |
Footnotes
*The racial-ethnic minorities count is calculated by taking the total number of students and subtracting white students, international students, and students whose race/ethnicity was unknown. This number is then divided by the total number of students at the school to obtain the racial-ethnic minorities percentage.
References
More about our data sources and methodologies.