Welch total enrollment is approximately 358 students. 219 are undergraduates and 4 are graduate students.
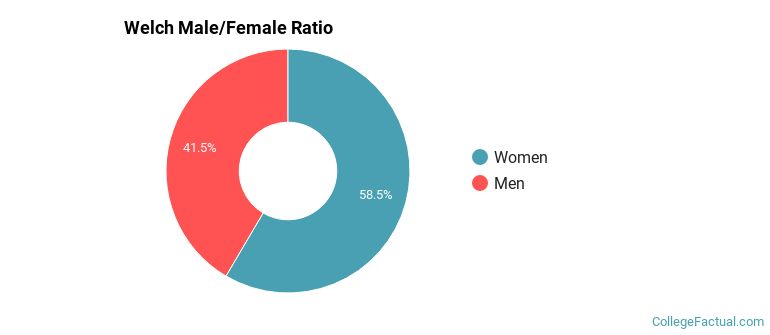
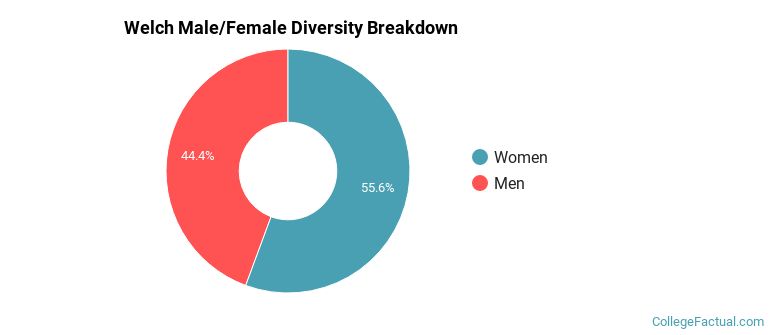
Male/Female Breakdown of Undergraduates
The full-time Welch undergraduate population is made up of 55% women, and 45% men.
For the gender breakdown for all students, go here.
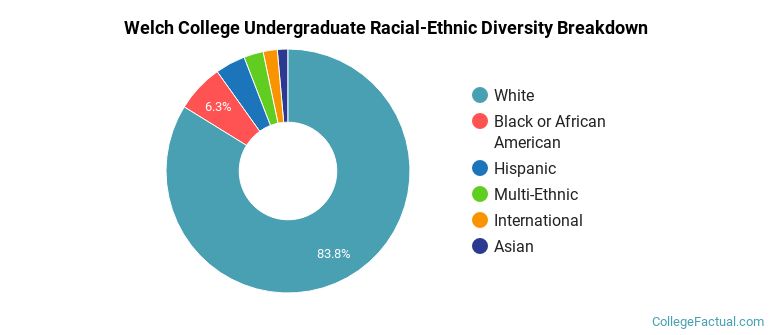
Welch Racial/Ethnic Breakdown of Undergraduates
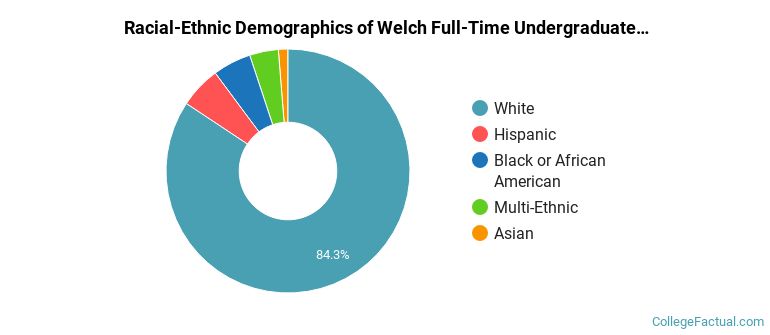
| Race/Ethnicity | Number |
|---|---|
| White | 185 |
| Black or African American | 16 |
| Hispanic | 9 |
| Multi-Ethnic | 9 |
| Asian | 0 |
| Native Hawaiian or Pacific Islander | 0 |
| International | 0 |
| Unknown | 0 |
See racial/ethnic breakdown for all students.
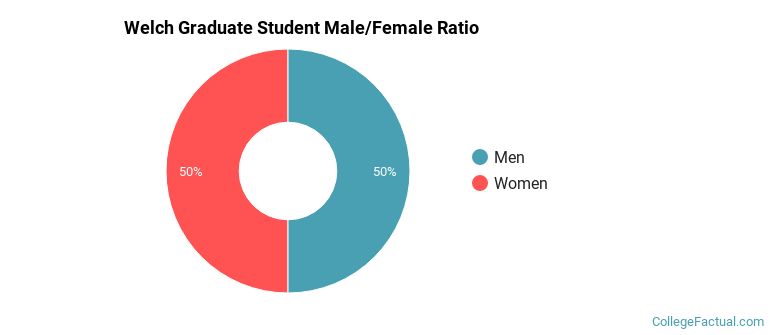
Male/Female Breakdown of Graduate Students
About 50% of full-time grad students are women, and 50% men.
For the gender breakdown for all students, go here.
Welch Racial-Ethnic Breakdown of Graduate Students
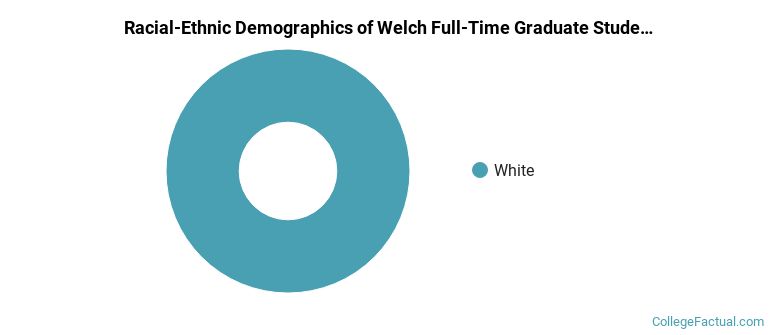
| Race/Ethnicity | Number |
|---|---|
| White | 3 |
| Black or African American | 1 |
| Asian | 0 |
| Hispanic | 0 |
| Native Hawaiian or Pacific Islander | 0 |
| International | 0 |
| Multi-Ethnic | 0 |
| Unknown | 0 |
See racial/ethnic breakdown for all students.
| Race/Ethnicity | Number |
|---|---|
| White | 294 |
| Black or African American | 26 |
| Hispanic | 15 |
| Multi-Ethnic | 12 |
| International | 7 |
| Asian | 3 |
| Native Hawaiian or Pacific Islander | 0 |
| Unknown | 0 |
There are approximately 202 female students and 156 male students at Welch.
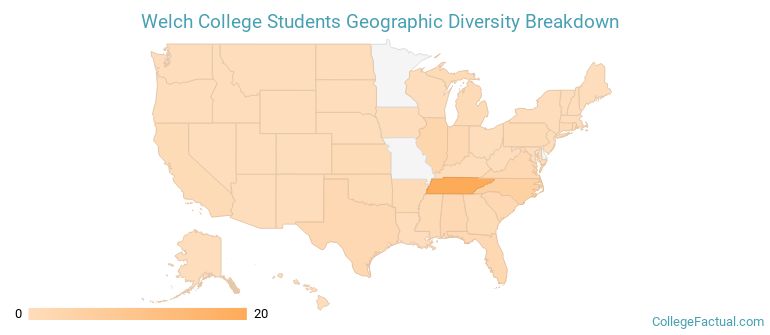
Welch ranks 495 out of 2,183 when it comes to geographic diversity.
61.54% of Welch students come from out of state, and 1.72% come from out of the country.
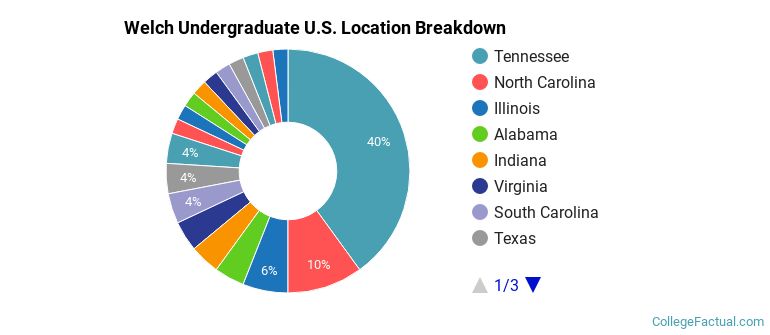
The undergraduate student body is split among 19 states (may include Washington D.C.). Click on the map for more detail.
| State | Amount |
|---|---|
| Tennessee | 20 |
| North Carolina | 5 |
| Illinois | 3 |
| Alabama | 2 |
| Florida | 2 |
A traditional college student is defined as being between the ages of 18-21. At Welch, 50.27% of students fall into that category, compared to the national average of 60%.
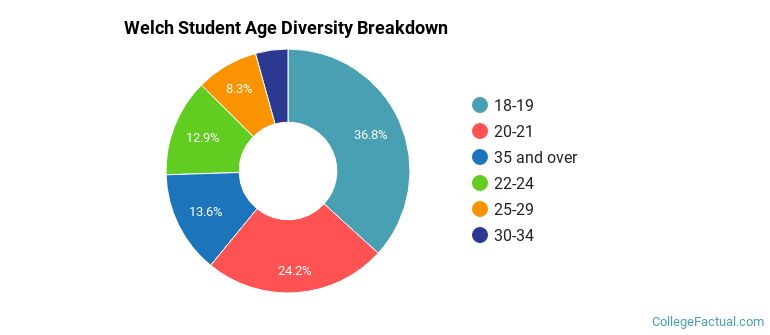
| Student Age Group | Amount |
|---|---|
| 18-19 | 111 |
| 20-21 | 73 |
| 35 and over | 41 |
| 22-24 | 39 |
| 25-29 | 25 |
| 30-34 | 13 |
| Under 18 | 0 |
Footnotes
*The racial-ethnic minorities count is calculated by taking the total number of students and subtracting white students, international students, and students whose race/ethnicity was unknown. This number is then divided by the total number of students at the school to obtain the racial-ethnic minorities percentage.
References
Department of Homeland Security Citizenship and Immigration Services
Image Credit: By The Peep Holes under License
Read College Factual's Diversity Ranking Methodology.