
College Factual recognizes the best colleges and universities in its annual rankings. These rankings include categories for best overall colleges, best colleges for each major, best value schools, and much more.
Gaston College was awarded 39 badges in the 2025 rankings. The highest ranked major at the school is health & medical administrative services.
Explore the best ranked schools for the programs you are most interested in.
According to College Factual's 2025 analysis, Gaston College is ranked #491 out of 2,152 schools in the nation that were analyzed for overall quality. This is an improvement over the previous year, when Gaston College held the #1,012 spot on the Best Overall Colleges list.
Gaston College also holds the #15 spot on the Best Colleges in North Carolina ranking.
Gaston College has an open admissions policy, so you should not have much trouble being accepted by the school. Still, it is important to fill out the application completely and submit any requested materials, which may include proof that you have a high school diploma or the equivalent.
The student to faculty ratio is often used to estimate how much interaction there is between professors and their students at a college or university. At Gaston College, this ratio is 13 to 1, which is on par with the national average of 15 to 1. That's not bad at all.
In addition to the student to faculty ratio, some people look at what percentage of faculty members are full-time as a sign of how much time professors will be able to spend with their students. This is because part-time teachers may not be be on campus as much as their full-time counterparts.
The full-time faculty percentage at Gaston College is 100%. This is higher than the national average of 47%.
The freshmen retention rate of 75% tells us that most first-year, full-time students like Gaston College enough to come back for another year. This is a fair bit higher than the national average of 68%. That's certainly something to check off in the good column about the school.
During the 2017-2018 academic year, there were 5,345 undergraduates at Gaston College with 1,230 being full-time and 4,115 being part-time.
| $0-30 K | $30K-48K | $48-75 | $75-110K | $110K + |
|---|---|---|---|---|
| $2,326 | $4,013 | $6,877 | $6,624 | $9,084 |
The net price is calculated by adding tuition, room, board and other costs and subtracting financial aid.Note that the net price is typically less than the published for a school. For more information on the sticker price of Gaston College, see our tuition and fees and room and board pages.
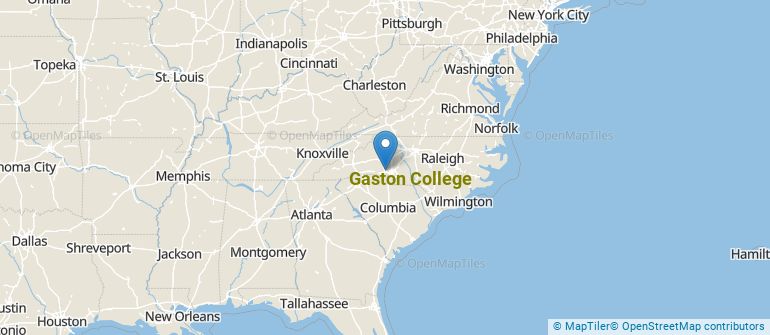
Get more details about the location of Gaston College.
Contact details for Gaston College are given below.
| Contact Details | |
|---|---|
| Address: | 201 Hwy 321 S, Dallas, NC 28034 |
| Phone: | 704-922-6200 |
| Website: | www.gaston.edu/ |
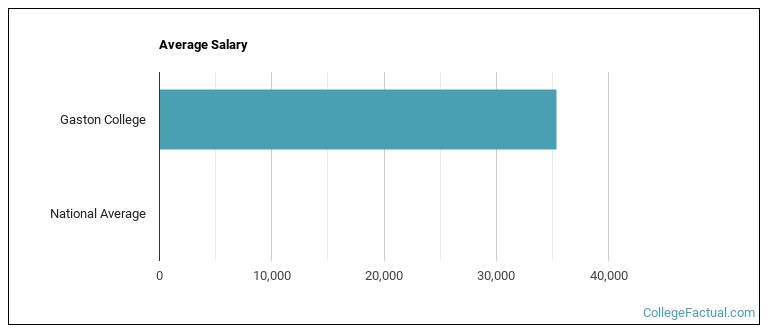
| Most Popular Majors | Bachelor’s Degrees | Average Salary of Graduates |
|---|---|---|
| Biotechnology | 1,152 | NA |
| Nursing | 387 | NA |
| Liberal Arts General Studies | 384 | NA |
| Practical Nursing & Nursing Assistants | 296 | NA |
| Business Administration & Management | 272 | NA |
| Criminal Justice & Corrections | 112 | NA |
| Health & Medical Administrative Services | 93 | NA |
| Precision Metal Working | 74 | NA |
| Veterinary/Animal Health Technologies/Technicians | 69 | NA |
| Accounting | 59 | NA |
Online learning options are becoming more and more popular at American colleges and universities. Online classes are great for students who have busy schedules or for those who just want to study on their own time.
In 2022-2023, 5,200 students took at least one online class at Gaston College. This is an increase from the 4,616 students who took online classes the previous year.
| Year | Took at Least One Online Class | Took All Classes Online |
|---|---|---|
| 2022-2023 | 5,200 | 2,705 |
| 2021-2022 | 4,616 | 2,752 |
| 2020-2021 | 4,778 | 4,266 |
| 2018-2019 | 3,086 | 1,570 |
Footnotes
*The racial-ethnic minorities count is calculated by taking the total number of students and subtracting white students, international students, and students whose race/ethnicity was unknown. This number is then divided by the total number of students at the school to obtain the racial-ethnic minorities percentage.
References
More about our data sources and methodologies.