GWU total enrollment is approximately 27,017 students. 10,141 are undergraduates and 7,361 are graduate students.
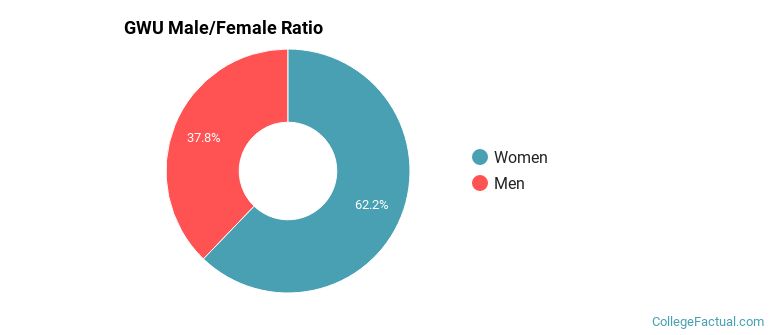
Male/Female Breakdown of Undergraduates
The full-time GWU undergraduate population is made up of 63% women, and 37% men.
For the gender breakdown for all students, go here.
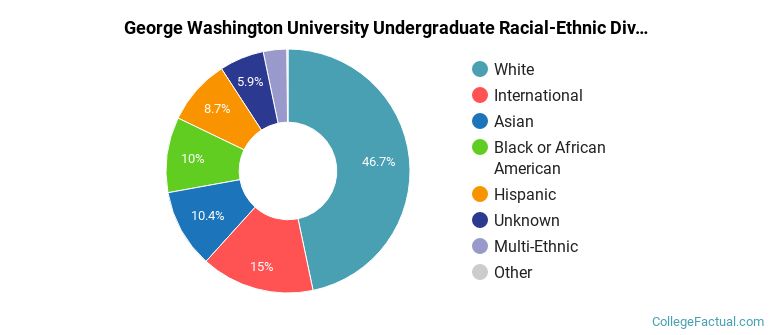
GWU Racial/Ethnic Breakdown of Undergraduates
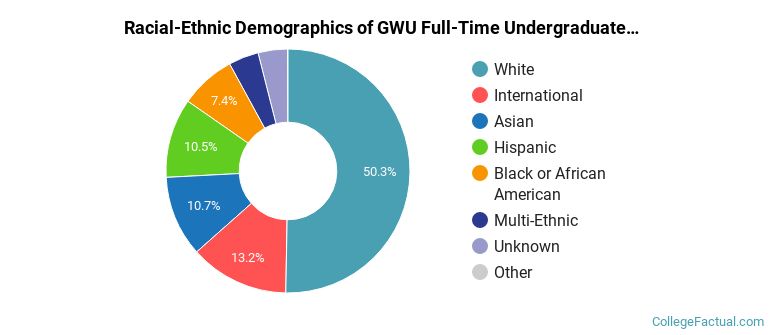
| Race/Ethnicity | Number |
|---|---|
| White | 5,053 |
| Asian | 1,214 |
| Hispanic | 1,174 |
| International | 1,111 |
| Black or African American | 811 |
| Multi-Ethnic | 469 |
| Unknown | 290 |
| Native Hawaiian or Pacific Islander | 12 |
See racial/ethnic breakdown for all students.
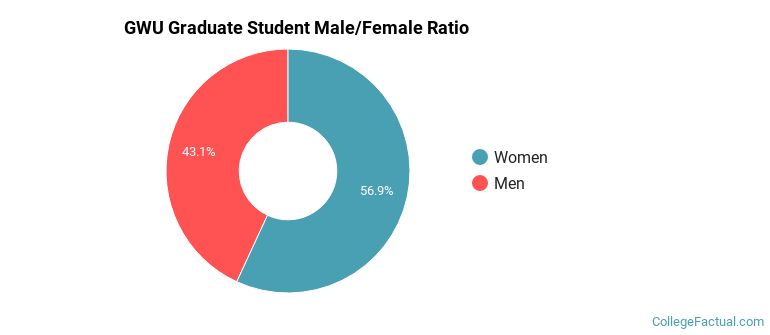
Male/Female Breakdown of Graduate Students
About 58% of full-time grad students are women, and 42% men.
For the gender breakdown for all students, go here.
GWU Racial-Ethnic Breakdown of Graduate Students
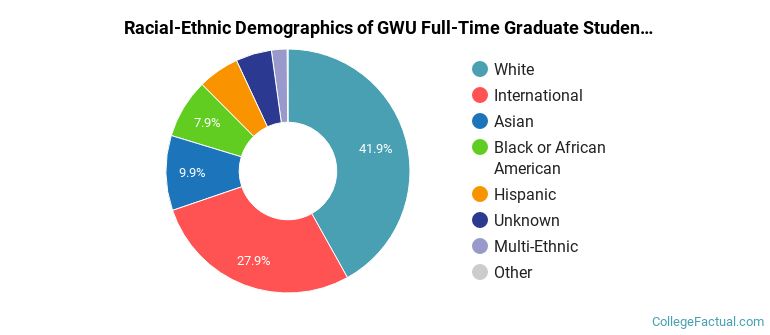
| Race/Ethnicity | Number |
|---|---|
| White | 3,288 |
| International | 1,517 |
| Asian | 763 |
| Black or African American | 630 |
| Hispanic | 557 |
| Unknown | 394 |
| Multi-Ethnic | 175 |
| Native Hawaiian or Pacific Islander | 13 |
See racial/ethnic breakdown for all students.
| Race/Ethnicity | Number |
|---|---|
| White | 12,508 |
| International | 3,310 |
| Hispanic | 2,991 |
| Asian | 2,955 |
| Black or African American | 2,786 |
| Unknown | 1,461 |
| Multi-Ethnic | 914 |
| Native Hawaiian or Pacific Islander | 39 |

There are approximately 16,798 female students and 10,219 male students at GWU.
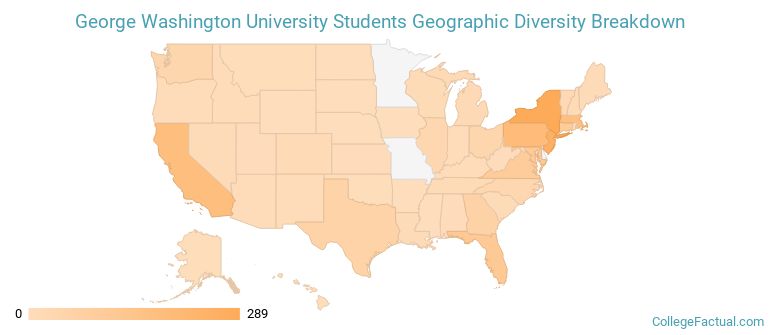
GWU ranks 7 out of 2,183 when it comes to geographic diversity.
95.8% of GWU students come from out of state, and 12.59% come from out of the country.
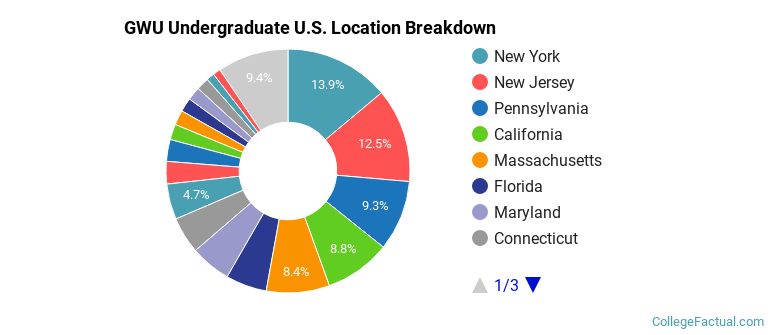
The undergraduate student body is split among 47 states (may include Washington D.C.). Click on the map for more detail.
| State | Amount |
|---|---|
| New York | 289 |
| New Jersey | 259 |
| Pennsylvania | 194 |
| California | 182 |
| Massachusetts | 174 |
Students from 133 countries are represented at this school, with the majority of the international students coming from China, India, and South Korea.
Learn more about international students at GWU.
A traditional college student is defined as being between the ages of 18-21. At GWU, 30.90% of students fall into that category, compared to the national average of 60%.
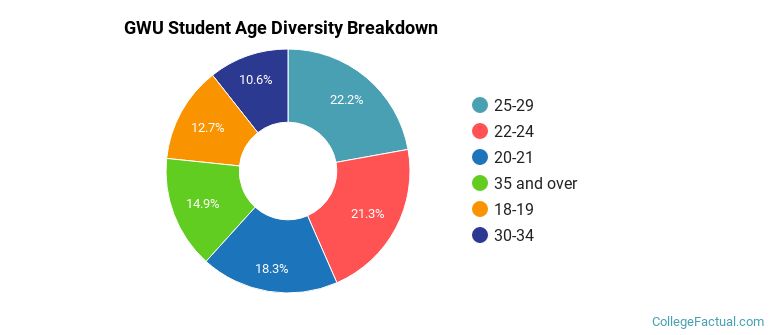
| Student Age Group | Amount |
|---|---|
| 25-29 | 6,177 |
| 22-24 | 5,926 |
| 20-21 | 5,095 |
| 35 and over | 4,159 |
| 18-19 | 3,549 |
| 30-34 | 2,959 |
| Under 18 | 0 |
Footnotes
*The racial-ethnic minorities count is calculated by taking the total number of students and subtracting white students, international students, and students whose race/ethnicity was unknown. This number is then divided by the total number of students at the school to obtain the racial-ethnic minorities percentage.
References
Department of Homeland Security Citizenship and Immigration Services
Image Credit: By Michiel1972 under License
Read College Factual's Diversity Ranking Methodology.