Gonzaga total enrollment is approximately 7,295 students. 4,744 are undergraduates and 687 are graduate students.
Male/Female Breakdown of Undergraduates
The full-time Gonzaga undergraduate population is made up of 53% women, and 47% men.

For the gender breakdown for all students, go here.
Gonzaga Racial/Ethnic Breakdown of Undergraduates

| Race/Ethnicity | Number |
|---|---|
| White | 3,310 |
| Hispanic | 536 |
| Multi-Ethnic | 342 |
| Asian | 285 |
| Unknown | 109 |
| International | 67 |
| Black or African American | 63 |
| Native Hawaiian or Pacific Islander | 11 |
See racial/ethnic breakdown for all students.
Male/Female Breakdown of Graduate Students
About 56% of full-time grad students are women, and 44% men.

For the gender breakdown for all students, go here.
Gonzaga Racial-Ethnic Breakdown of Graduate Students

| Race/Ethnicity | Number |
|---|---|
| White | 509 |
| Hispanic | 60 |
| Unknown | 35 |
| Multi-Ethnic | 32 |
| Asian | 17 |
| International | 16 |
| Black or African American | 12 |
| Native Hawaiian or Pacific Islander | 1 |
See racial/ethnic breakdown for all students.

| Race/Ethnicity | Number |
|---|---|
| White | 5,036 |
| Hispanic | 723 |
| Multi-Ethnic | 470 |
| Asian | 371 |
| Unknown | 298 |
| International | 171 |
| Black or African American | 156 |
| Native Hawaiian or Pacific Islander | 21 |

There are approximately 4,185 female students and 3,110 male students at Gonzaga.
Gonzaga ranks 367 out of 2,183 when it comes to geographic diversity.
55.04% of Gonzaga students come from out of state, and 0.79% come from out of the country.
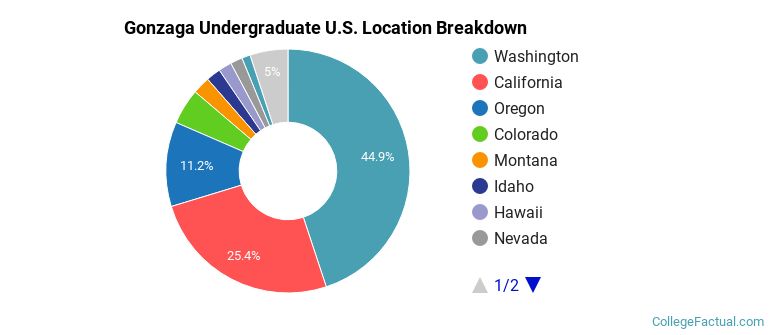
The undergraduate student body is split among 29 states (may include Washington D.C.). Click on the map for more detail.

| State | Amount |
|---|---|
| Washington | 561 |
| California | 317 |
| Oregon | 140 |
| Colorado | 59 |
| Montana | 29 |
Students from 48 countries are represented at this school, with the majority of the international students coming from Canada, Saudi Arabia, and China.
Learn more about international students at Gonzaga.
A traditional college student is defined as being between the ages of 18-21. At Gonzaga, 62.83% of students fall into that category, compared to the national average of 60%.

| Student Age Group | Amount |
|---|---|
| 20-21 | 2,376 |
| 18-19 | 2,340 |
| 35 and over | 1,029 |
| 22-24 | 718 |
| 25-29 | 574 |
| 30-34 | 411 |
| Under 18 | 0 |
Footnotes
*The racial-ethnic minorities count is calculated by taking the total number of students and subtracting white students, international students, and students whose race/ethnicity was unknown. This number is then divided by the total number of students at the school to obtain the racial-ethnic minorities percentage.
References
Department of Homeland Security Citizenship and Immigration Services
Image Credit: By Gregg M. Erickson under License