Below are the key facts about this program at Grand Rapids Community College. It is offered at the Associate’s, Undergraduate Certificate levels. At its best it places at #1 out of 9 schools (Associate’s level) by College Factual. Jump to any of the following sections:
By College Factual’s measure, Grand Rapids Community College among the top schools in the country for culinary arts, placing at #32 out of 183 schools nationally.
| Ranking | Rank |
|---|---|
| Best Culinary Arts Schools | 32 of 183 |
| Best Culinary Arts Schools in Michigan | 1 of 9 |
| Best Culinary Arts Schools in the Great Lakes Region | 5 of 30 |
The following degree levels are granted in culinary arts at Grand Rapids Community College, along with how many graduates complete each level annually.
| Degree Level | Annual Graduates |
|---|---|
| Associate’s | 25 |
| Undergraduate Certificate | 34 |
During the most recent reporting year, Grand Rapids Community College awarded 25 associate’s degrees in culinary arts.
Grand Rapids Community College is among the very best schools in the country for culinary arts at the associate’s level. Specifically, it ranked #1 out of 9 schools by College Factual.
| Ranking | Rank |
|---|---|
| Best Culinary Arts Associate Degree Schools in Michigan | 1 |
| Best Culinary Arts Associate Degree Schools in the Great Lakes Region | 5 |
| Best Culinary Arts Associate Degree Schools | 29 |
Information about average full-time undergraduate tuition and fees is shown in the table below.
| In State | Out of State | |
|---|---|---|
| Tuition | $7,410 | $11,760 |
| Fees | $459 | $459 |
Read more about Grand Rapids Community College tuition and fees.
In the most recent graduating class, 52% of culinary arts associate’s degrees went to men and 48% went to women.
 The majority of culinary arts associate’s degree graduates at Grand Rapids Community College were White. About 68% of graduates fell into this category.
The following table and chart show the ethnic background for students who recently graduated from Grand Rapids Community College with a associate’s in culinary arts.
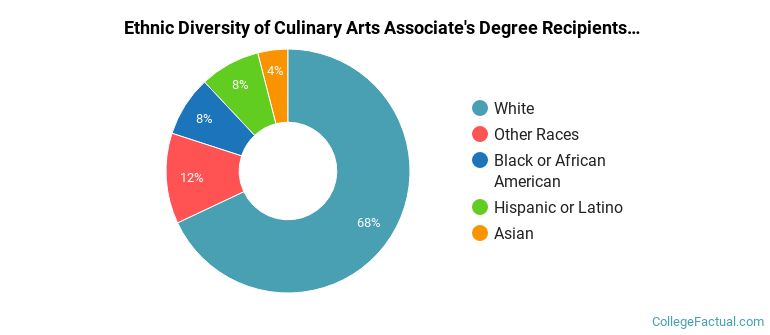
| Ethnic Background | Number of Students |
|---|---|
| Asian | 1 |
| Black or African American | 2 |
| Hispanic or Latino | 2 |
| White | 17 |
| Non-Resident Aliens | 0 |
| Other Races | 3 |
Grand Rapids Community College conferred 25 associate’s degrees in culinary arts/chef training in the latest year of data — 48% to women and 52% to men. Most of these graduates identified as White (68%).
During the most recent reporting year, Grand Rapids Community College handed out 34 undergraduate certificate degrees in culinary arts.
Grand Rapids Community College has not been ranked for culinary arts at the undergraduate certificate level.
For the most recent academic year available, 32% of culinary arts undergraduate certificate degrees went to men and 68% went to women.
 The majority of culinary arts undergraduate certificate degree graduates at Grand Rapids Community College are White. Approximately 71% of graduates fell into this category.
The following table and chart show the ethnic background for students who recently graduated from Grand Rapids Community College with a undergraduate certificate in culinary arts.
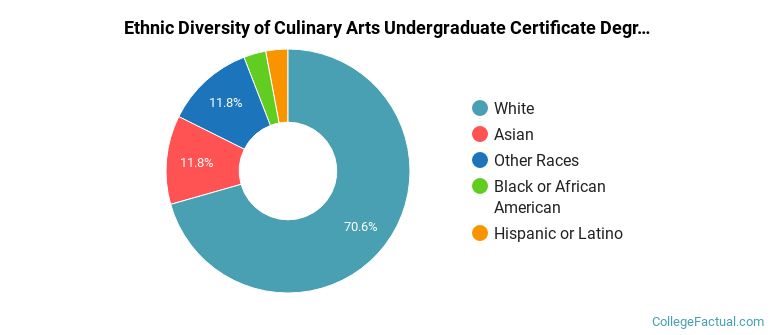
| Ethnic Background | Number of Students |
|---|---|
| Asian | 4 |
| Black or African American | 1 |
| Hispanic or Latino | 1 |
| White | 24 |
| Non-Resident Aliens | 0 |
| Other Races | 4 |
Grand Rapids Community College conferred 14 undergraduate certificate degrees in baking and pastry arts/baker/pastry chef in the latest year of data — 100% to women and 0% to men. The most common background among these graduates was White (79%).
Grand Rapids Community College granted 11 undergraduate certificate completions in culinary arts and related services in the most recent reporting year — 45% to women and 55% to men. The largest share of these graduates were White (73%).
Grand Rapids Community College granted 9 undergraduate certificate degrees in culinary arts/chef training in the most recent reporting year — 44% to women and 56% to men. The largest share of these graduates were White (56%).
More about our data sources and methodologies.