GVSU total enrollment is approximately 23,350 students. 18,013 are undergraduates and 1,446 are graduate students.
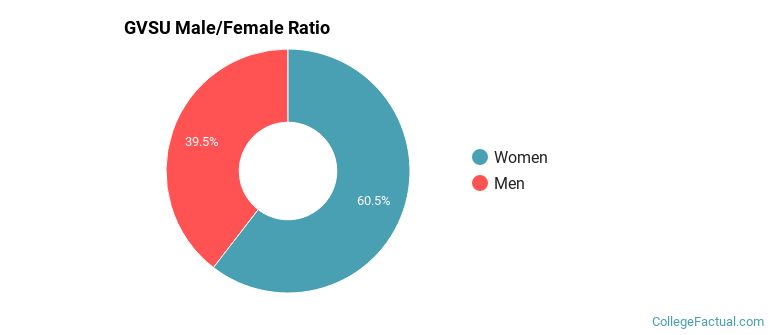
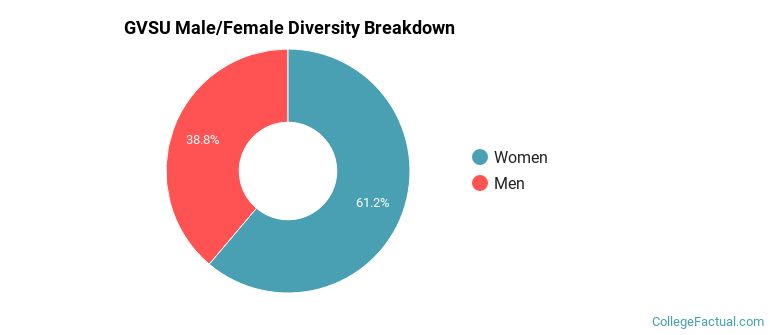
Male/Female Breakdown of Undergraduates
The full-time GVSU undergraduate population is made up of 61% women, and 39% men.
For the gender breakdown for all students, go here.
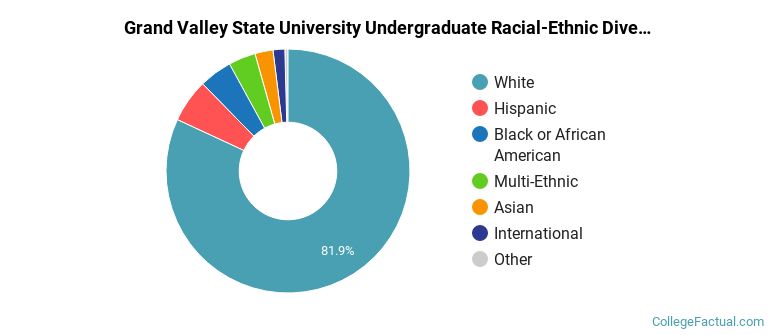
GVSU Racial/Ethnic Breakdown of Undergraduates

| Race/Ethnicity | Number |
|---|---|
| White | 14,869 |
| Hispanic | 1,036 |
| Black or African American | 713 |
| Multi-Ethnic | 700 |
| Asian | 423 |
| International | 161 |
| Unknown | 40 |
| Native Hawaiian or Pacific Islander | 16 |
See racial/ethnic breakdown for all students.
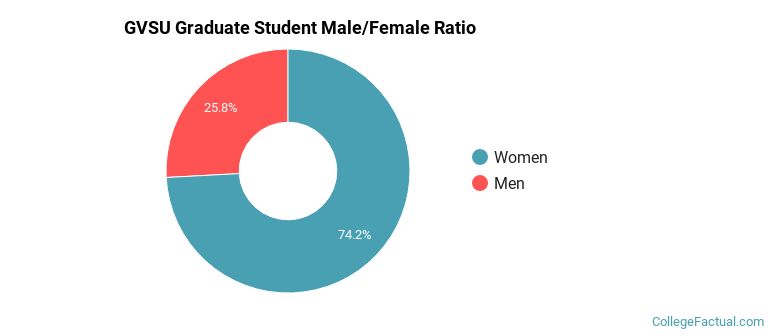
Male/Female Breakdown of Graduate Students
About 77% of full-time grad students are women, and 23% men.
For the gender breakdown for all students, go here.
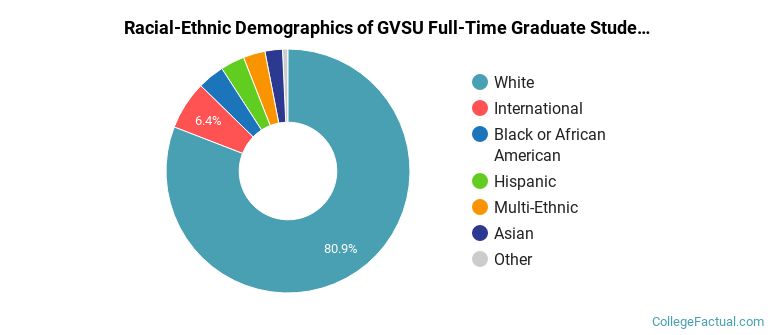
GVSU Racial-Ethnic Breakdown of Graduate Students
| Race/Ethnicity | Number |
|---|---|
| White | 1,157 |
| International | 88 |
| Hispanic | 52 |
| Asian | 48 |
| Black or African American | 44 |
| Multi-Ethnic | 44 |
| Unknown | 7 |
| Native Hawaiian or Pacific Islander | 1 |
See racial/ethnic breakdown for all students.
| Race/Ethnicity | Number |
|---|---|
| White | 19,064 |
| Hispanic | 1,351 |
| Black or African American | 989 |
| Multi-Ethnic | 866 |
| Asian | 588 |
| International | 312 |
| Unknown | 75 |
| Native Hawaiian or Pacific Islander | 20 |
There are approximately 14,513 female students and 8,837 male students at GVSU.
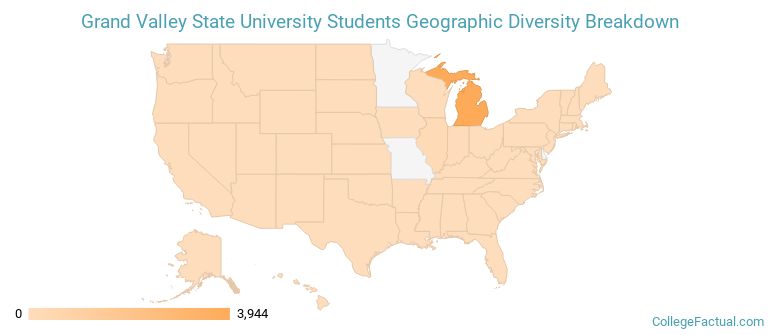
GVSU ranks 1,330 out of 2,183 when it comes to geographic diversity.
7.89% of GVSU students come from out of state, and 0.56% come from out of the country.
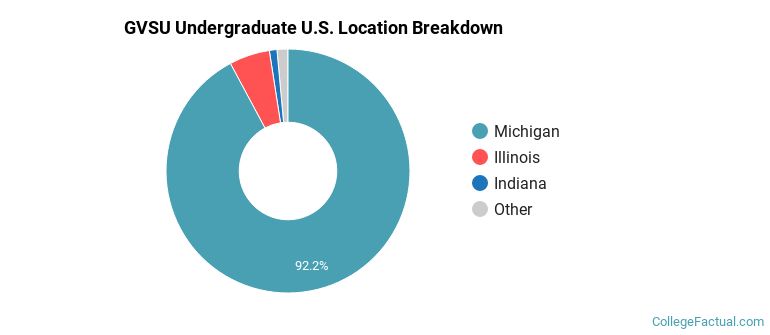
The undergraduate student body is split among 24 states (may include Washington D.C.). Click on the map for more detail.
| State | Amount |
|---|---|
| Michigan | 3,944 |
| Illinois | 230 |
| Indiana | 43 |
| Ohio | 16 |
| Maryland | 6 |
Students from 86 countries are represented at this school, with the majority of the international students coming from India, China, and Saudi Arabia.
Learn more about international students at GVSU.
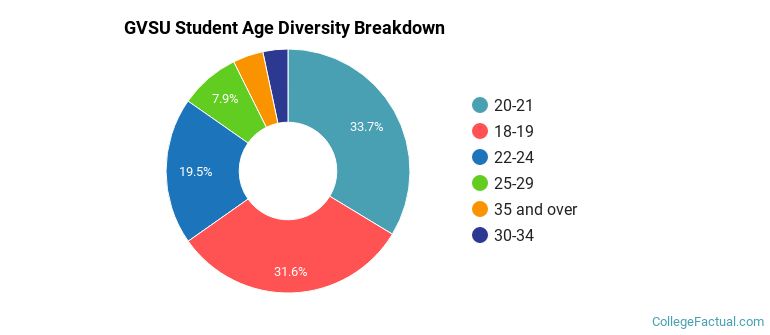
A traditional college student is defined as being between the ages of 18-21. At GVSU, 63.99% of students fall into that category, compared to the national average of 60%.
| Student Age Group | Amount |
|---|---|
| 20-21 | 8,269 |
| 18-19 | 7,759 |
| 22-24 | 4,782 |
| 25-29 | 1,952 |
| 35 and over | 988 |
| 30-34 | 816 |
| Under 18 | 0 |
Footnotes
*The racial-ethnic minorities count is calculated by taking the total number of students and subtracting white students, international students, and students whose race/ethnicity was unknown. This number is then divided by the total number of students at the school to obtain the racial-ethnic minorities percentage.
References
Department of Homeland Security Citizenship and Immigration Services
Learn more about how College Factual creates their Diversity Rankings.