Gratz College total enrollment is approximately 454 students. 70 are undergraduates and 31 are graduate students.
Male/Female Breakdown of Undergraduates
The full-time Gratz College undergraduate population is made up of 100% women, and 0% men.
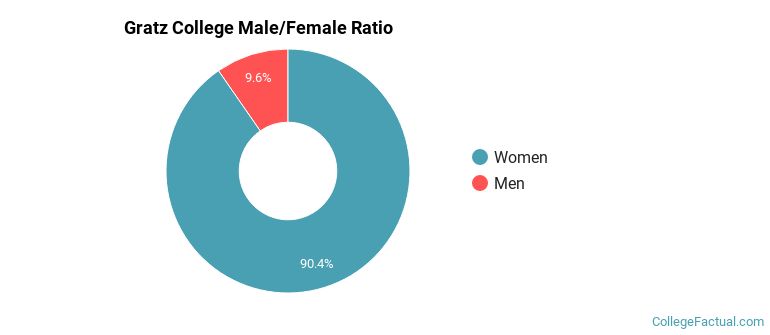
For the gender breakdown for all students, go here.
Gratz College Racial/Ethnic Breakdown of Undergraduates
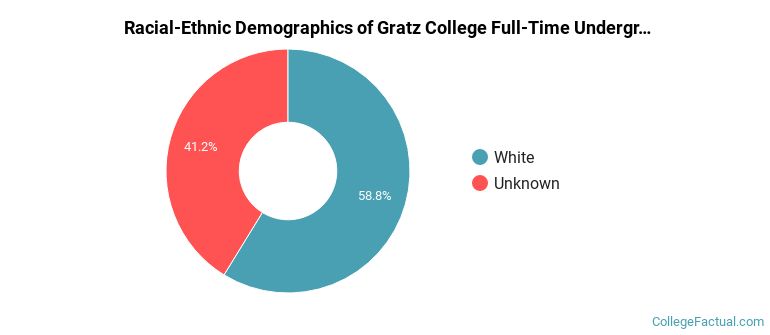
| Race/Ethnicity | Number |
|---|---|
| White | 70 |
| Asian | 0 |
| Black or African American | 0 |
| Hispanic | 0 |
| Native Hawaiian or Pacific Islander | 0 |
| International | 0 |
| Multi-Ethnic | 0 |
| Unknown | 0 |
See racial/ethnic breakdown for all students.
Male/Female Breakdown of Graduate Students
About 61% of full-time grad students are women, and 39% men.
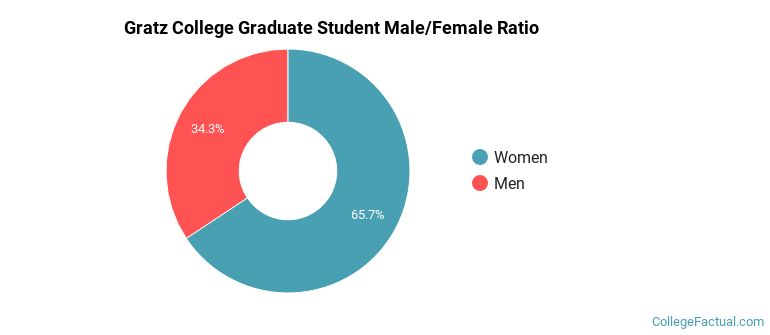
For the gender breakdown for all students, go here.
Gratz College Racial-Ethnic Breakdown of Graduate Students
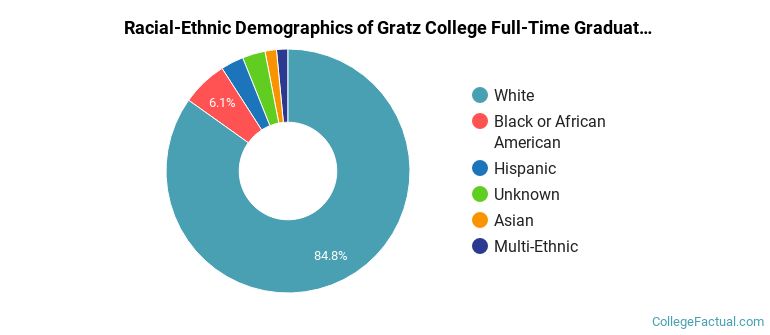
| Race/Ethnicity | Number |
|---|---|
| White | 28 |
| Multi-Ethnic | 2 |
| Hispanic | 1 |
| Asian | 0 |
| Black or African American | 0 |
| Native Hawaiian or Pacific Islander | 0 |
| International | 0 |
| Unknown | 0 |
See racial/ethnic breakdown for all students.
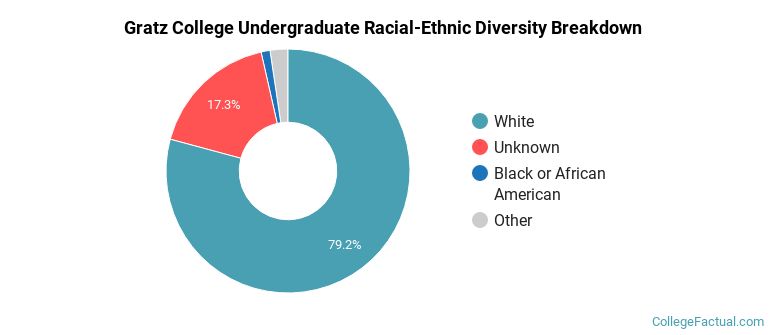
| Race/Ethnicity | Number |
|---|---|
| White | 399 |
| Unknown | 31 |
| Multi-Ethnic | 8 |
| Asian | 5 |
| Hispanic | 5 |
| Black or African American | 4 |
| Native Hawaiian or Pacific Islander | 1 |
| International | 0 |
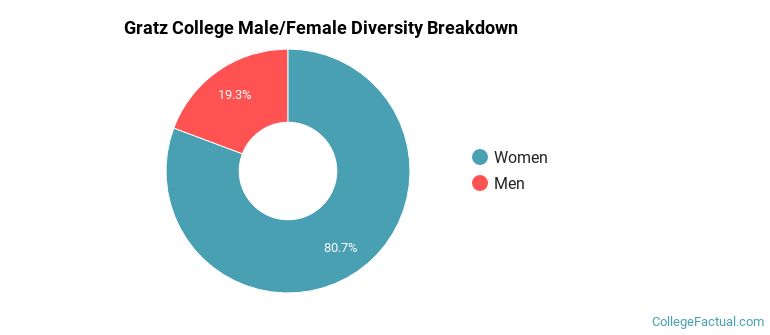
There are approximately 356 female students and 98 male students at Gratz College.
A traditional college student is defined as being between the ages of 18-21. At Gratz College, 19.03% of students fall into that category, compared to the national average of 60%.
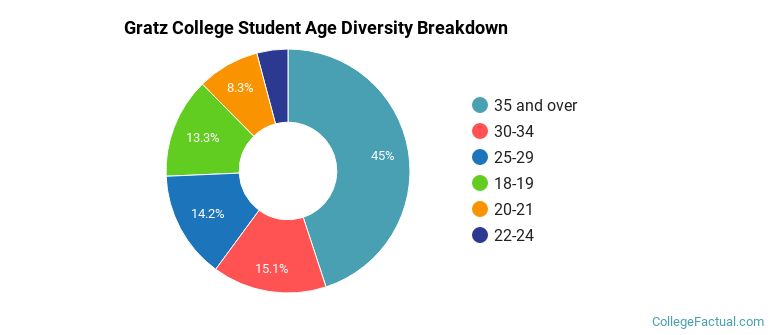
| Student Age Group | Amount |
|---|---|
| 35 and over | 98 |
| 30-34 | 33 |
| 25-29 | 31 |
| 18-19 | 29 |
| 20-21 | 18 |
| 22-24 | 9 |
| Under 18 | 0 |
Footnotes
*The racial-ethnic minorities count is calculated by taking the total number of students and subtracting white students, international students, and students whose race/ethnicity was unknown. This number is then divided by the total number of students at the school to obtain the racial-ethnic minorities percentage.
References
Department of Homeland Security Citizenship and Immigration Services
Find out how College Factual created their Diversity Rankings.