 by our College Data Analytics Team
Explore the best ranked schools for the programs you are most interested in.
Hazleton Area Career Center was not ranked in College Factual's 2025 Best Overall Colleges report. This could be for a number of reasons, including lack of data.
Returning adults and other non-traditional students may appreciate the fact that Hazleton Area Career Center has an open admissions policy. This means that you'll only have to submit basic materials, which may include proof that you completed high school or an equivalent program.
The student to faculty ratio at Hazleton Area Career Center is an impressive 7 to 1. That's quite good when you compare it to the national average of 15 to 1. This is a good sign that students at the school will have more opportunities for one-on-one interactions with their professors.
During the 2017-2018 academic year, there were 8 full-time undergraduates at Hazleton Area Career Center.
The net price is calculated by adding tuition, room, board and other costs and subtracting financial aid.Note that the net price is typically less than the published for a school. For more information on the sticker price of Hazleton Area Career Center, see our tuition and fees and room and board pages.
It's not uncommon for college students to take out loans to pay for school. In fact, almost 66% of students nationwide depend at least partially on loans. At Hazleton Area Career Center, approximately 33% of students took out student loans averaging $8,166 a year. That adds up to $32,664 over four years for those students.
Get more details about paying for Hazleton Area Career Center.
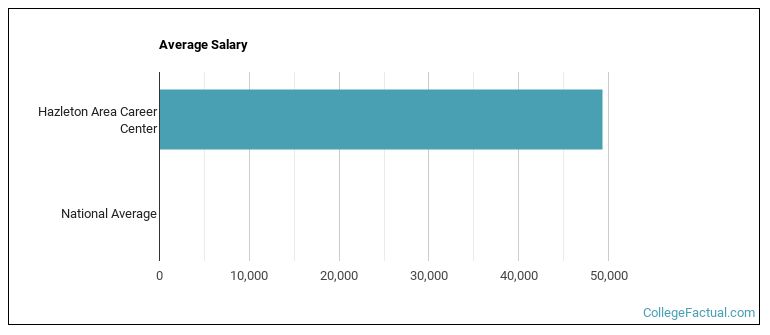
See which majors at Hazleton Area Career Center make the most money.
Get more details about the location of Hazleton Area Career Center.

Contact details for Hazleton Area Career Center are given below.
| Contact Details | |
|---|---|
| Address: | 1451 West 23Rd Street, Hazle TWP., PA 18202 |
| Phone: | 570-459-3221 |
| Website: | www.hasdk12.org/ |
Footnotes
*The racial-ethnic minorities count is calculated by taking the total number of students and subtracting white students, international students, and students whose race/ethnicity was unknown. This number is then divided by the total number of students at the school to obtain the racial-ethnic minorities percentage.
References
More about our data sources and methodologies.