We’ve pulled together the essential facts you should know about the program at Hennepin Technical College. It is offered at the Associate’s, Certificate levels. Jump to any of the following sections:
The table below lists every degree level offered in culinary arts at Hennepin Technical College, along with how many graduates complete each level annually.Degree Level Annual Graduates Associate’s 13 Certificate 35
During the most recent reporting year, Hennepin Technical College awarded 13 associate’s degrees in culinary arts.
Hennepin Technical College is not yet ranked for culinary arts at the associate’s level.
The full-time undergraduate tuition and fees are shown below.In State Out of State Tuition $5,161 $5,342 Fees $598 $598
Learn more about Hennepin Technical College tuition and fees.
For the most recent academic year available, 46% of culinary arts associate’s degrees went to men and 54% went to women.
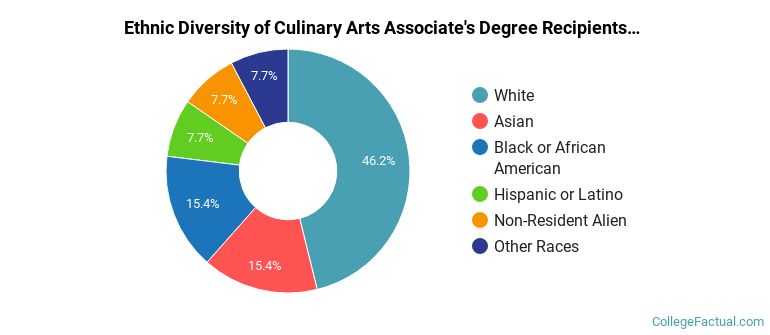
 The largest share of culinary arts associate’s degree graduates at Hennepin Technical College were White. About 46% of graduates fell into this category.
The following table and chart show the ethnic background for students who recently graduated from Hennepin Technical College with a associate’s in culinary arts.
| Ethnic Background | Number of Students |
|---|---|
| Asian | 2 |
| Black or African American | 2 |
| Hispanic or Latino | 1 |
| White | 6 |
| Non-Resident Aliens | 1 |
| Other Races | 1 |
Hennepin Technical College awarded 9 associate’s degrees in culinary arts/chef training recently — 33% to women and 67% to men. The largest share of these graduates were White (56%).
Hennepin Technical College awarded 4 associate’s degrees in baking and pastry arts/baker/pastry chef in the latest year of data — 100% to women and 0% to men. The most common background among these graduates was Asian (50%).
For the most recent IPEDS reporting year, Hennepin Technical College awarded 35 certificate degrees in culinary arts.
Hennepin Technical College is not yet ranked for culinary arts at the certificate level.
In the most recent graduating class, 29% of culinary arts certificate degrees went to men and 71% went to women.
 The majority of culinary arts certificate degree graduates at Hennepin Technical College are White. About 46% of graduates fell into this category.
The following table and chart show the ethnic background for students who recently graduated from Hennepin Technical College with a certificate in culinary arts.

| Ethnic Background | Number of Students |
|---|---|
| Asian | 4 |
| Black or African American | 6 |
| Hispanic or Latino | 3 |
| White | 16 |
| Non-Resident Aliens | 2 |
| Other Races | 4 |
Hennepin Technical College awarded 15 certificate degrees in baking and pastry arts/baker/pastry chef in the most recent reporting year — 93% to women and 7% to men. Most of these graduates identified as Asian (27%).
Hennepin Technical College awarded 12 certificate degrees in food preparation/professional cooking/kitchen assistant in the most recent reporting year — 58% to women and 42% to men. The most common background among these graduates was White (58%).
Hennepin Technical College granted 8 certificate completions in culinary arts/chef training recently — 50% to women and 50% to men. The largest share of these graduates were White (62%).
More about our data sources and methodologies.