College Factual analyzes over 2,000 colleges and universities in its annual rankings and ranks them in a variety of ways, including most diverse, best overall quality, best for non-traditional students, and much more.
Hesston College was awarded 5 badges in the 2025 rankings. The highest ranked major at the school is liberal arts general studies.
Explore the best ranked schools for the programs you are most interested in.
Hesston is ranked #899 out of 2,152 schools in the nation for overall quality on College Factual's 2025 Best Colleges list. This is an improvement over the previous year, when Hesston held the #1,508 spot on the Best Overall Colleges list.
Hesston is also ranked #8 out of 44 schools in Kansas.
Since Hesston College has an open admissions policy, being accepted to the school isn't that hard. However, a full basic things - such as a high school diploma or equivalent - may be required. Also, go over your application to make sure it is complete before you submit it.
At Hesston, the student to faculty ratio is an excellent 7 to 1. That's much better than the national average of 15 to 1. This indicates that many classes will probably be small, and students will have ample opportunites to work closely with their professors and classmates.
Another measure that is often used to estimate how much access students will have to their professors is how many faculty members are full-time. The idea here is that part-time faculty tend to spend less time on campus, so they may not be as available to students as full-timers.
The full-time faculty percentage at Hesston College is 65%. This is higher than the national average of 47%.
The freshmen retention rate of 82% tells us that most first-year, full-time students like Hesston College enough to come back for another year. This is a fair bit higher than the national average of 68%. That's certainly something to check off in the good column about the school.
During the 2017-2018 academic year, there were 359 undergraduates at Hesston with 330 being full-time and 29 being part-time.
| $0-30 K | $30K-48K | $48-75 | $75-110K | $110K + |
|---|---|---|---|---|
| $16,966 | $17,415 | $20,300 | $20,748 | $24,427 |
The net price is calculated by adding tuition, room, board and other costs and subtracting financial aid.Note that the net price is typically less than the published for a school. For more information on the sticker price of Hesston, see our tuition and fees and room and board pages.
It's not uncommon for college students to take out loans to pay for school. In fact, almost 66% of students nationwide depend at least partially on loans. At Hesston, approximately 81% of students took out student loans averaging $6,756 a year. That adds up to $27,024 over four years for those students.
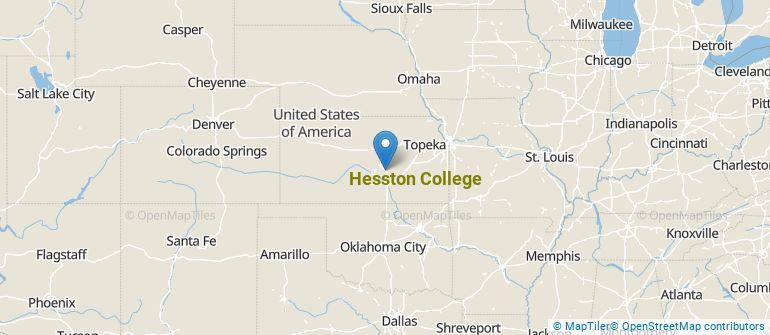
Get more details about the location of Hesston College.
Contact details for Hesston are given below.
| Contact Details | |
|---|---|
| Address: | 301 South Main, Hesston, KS 67062-2093 |
| Phone: | 620-327-4221 |
| Website: | www.hesston.edu/ |
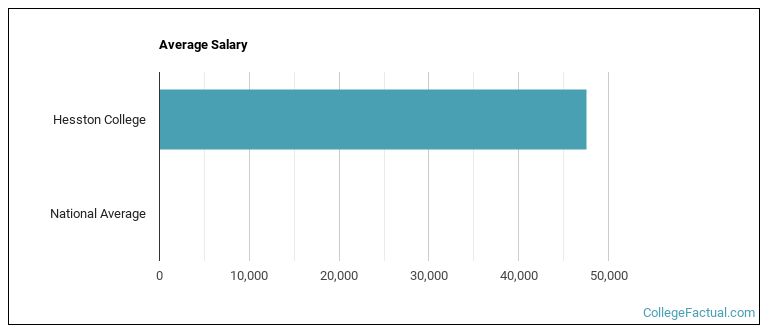
| Most Popular Majors | Bachelor’s Degrees | Average Salary of Graduates |
|---|---|---|
| Liberal Arts General Studies | 71 | NA |
| Nursing | 33 | $68,338 |
| Air Transportation | 3 | NA |
| General Business/Commerce | 0 | NA |
| Pastoral Counseling & Specialized Ministries | 0 | NA |
Online learning is becoming popular at even the oldest colleges and universities in the United States. Not only are online classes great for returning adults with busy schedules, they are also frequented by a growing number of traditional students.
In 2022-2023, 110 students took at least one online class at Hesston College. This is an increase from the 85 students who took online classes the previous year.
| Year | Took at Least One Online Class | Took All Classes Online |
|---|---|---|
| 2022-2023 | 110 | 9 |
| 2021-2022 | 85 | 13 |
| 2020-2021 | 6 | 5 |
| 2018-2019 | 0 | 0 |
Footnotes
*The racial-ethnic minorities count is calculated by taking the total number of students and subtracting white students, international students, and students whose race/ethnicity was unknown. This number is then divided by the total number of students at the school to obtain the racial-ethnic minorities percentage.
References
More about our data sources and methodologies.