Below are the key facts about this program at Hillsdale College. Degrees are awarded at the Bachelor’s level, with graduate study also available. Jump to any of the following sections:
The following degree levels are granted in political science & government at Hillsdale College, along with how many graduates complete each level annually.
| Degree Level | Annual Graduates |
|---|---|
| Bachelor’s | 33 |
| Master’s | 23 |
| Doctoral | 7 |
During the most recent reporting year, Hillsdale College awarded 33 bachelor’s degrees in political science & government.
Hillsdale College is not currently ranked for political science & government at the bachelor’s level.
Information about average full-time undergraduate tuition and fees is shown in the table below.
| In State | Out of State | |
|---|---|---|
| Tuition | $28,730 | $31,780 |
| Fees | $1,409 | $1,409 |
Find out more about Hillsdale College tuition and fees.
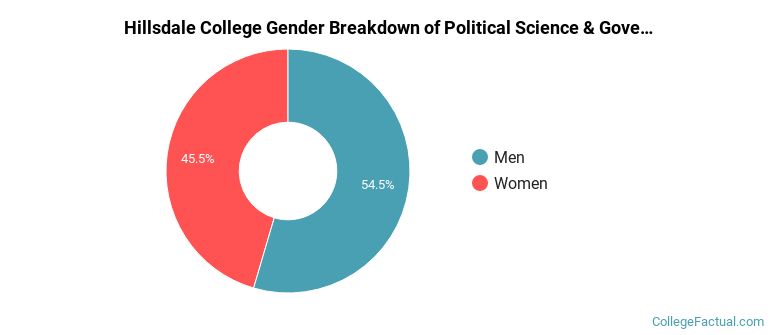
Among recent graduates, 55% of political science & government bachelor’s degrees went to men and 45% went to women.
The following table and chart show the ethnic background for students who recently graduated from Hillsdale College with a bachelor’s in political science & government.
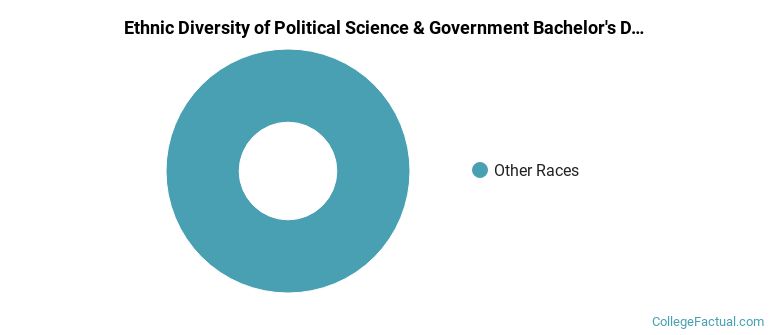
| Ethnic Background | Number of Students |
|---|---|
| Asian | 0 |
| Black or African American | 0 |
| Hispanic or Latino | 0 |
| White | 0 |
| Non-Resident Aliens | 0 |
| Other Races | 33 |
Hillsdale College awarded 24 bachelor’s degrees in political science and government, general in the latest year of data — 38% to women and 62% to men.
Hillsdale College granted 9 bachelor’s completions in political economy recently — 67% to women and 33% to men.
Graduate study is also available at Hillsdale College. Here are the graduate award levels offered.
| Graduate Level | Annual Graduates |
|---|---|
| Master’s Degrees in Political Science & Government | 23 |
| Doctoral Degrees in Political Science & Government | 7 |
More about our data sources and methodologies.