Explore the best ranked schools for the programs you are most interested in.
Randall was not ranked in College Factual's 2025 Best Overall Colleges report. This could be for a number of reasons, including lack of data.
If you're applying to Randall University you'll face some tough competition, since the school's acceptance rate is only 43%. Definitely don't wait until the last minute to submit your application, since applying early may be in your favor.
About 21% of students accepted to Randall submitted their SAT scores. When looking at the 25th through the 75th percentile, SAT Evidence-Based Reading and Writing scores ranged between 438 and 510. Math scores were between 408 and 523.
At Randall, the student to faculty ratio is an excellent 9 to 1. That's much better than the national average of 15 to 1. This indicates that many classes will probably be small, and students will have ample opportunites to work closely with their professors and classmates.
In addition to the student to faculty ratio, some people look at what percentage of faculty members are full-time as a sign of how much time professors will be able to spend with their students. This is because part-time teachers may not be be on campus as much as their full-time counterparts.
The full-time faculty percentage at Randall University is 32%. This is lower than the national average of 47%.
The freshmen retention rate is a sign of how many full-time students like a college or university well enough to come back for their sophomore year. At Randall University this rate is 51%, which is a bit lower than the national average of 68%.
The on-time graduation rate is the percent of first-time, full time students who obtain their bachelor's degree in four years or less. This rate is 8% for first-time, full-time students at Randall, which is lower than the national rate of 33.3%.
Find out more about the retention and graduation rates at Randall University.
During the 2017-2018 academic year, there were 295 undergraduates at Randall with 263 being full-time and 32 being part-time.
| $0-30 K | $30K-48K | $48-75 | $75-110K | $110K + |
|---|---|---|---|---|
| $18,557 | $18,696 | $21,109 | $21,400 | $22,532 |
The net price is calculated by adding tuition, room, board and other costs and subtracting financial aid.Note that the net price is typically less than the published for a school. For more information on the sticker price of Randall, see our tuition and fees and room and board pages.
Almost 66% of college students who graduated with the class of 2018 took out student loans, but that percentage varies from school to school. At Randall, approximately 43% of students took out student loans averaging $5,788 a year. That adds up to $23,152 over four years for those students.
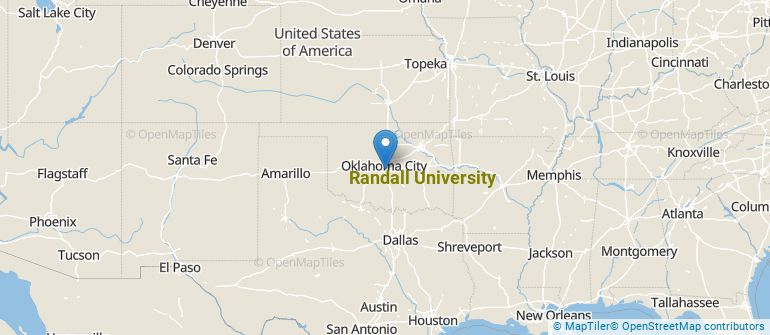
Get more details about the location of Randall University.
Contact details for Randall are given below.
| Contact Details | |
|---|---|
| Address: | 3701 S. I-35 Frontage Road, Moore, OK 73160 |
| Phone: | 405-912-9000 |
| Website: | www.ru.edu/ |
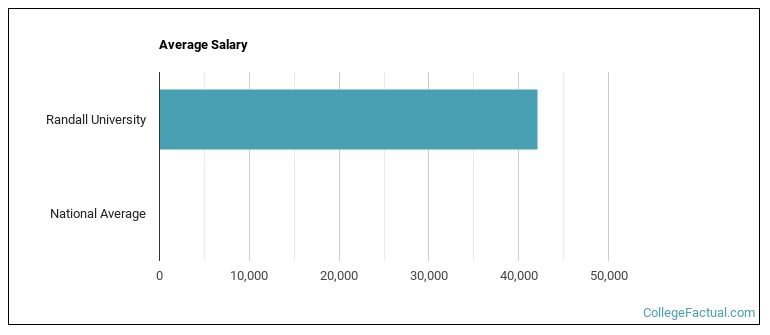
| Most Popular Majors | Bachelor’s Degrees | Average Salary of Graduates |
|---|---|---|
| Other Multi/Interdisciplinary Studies | 30 | NA |
| Health & Physical Education | 14 | NA |
| Liberal Arts General Studies | 11 | $38,244 |
| General Business/Commerce | 6 | NA |
| Public Administration | 6 | NA |
| Teacher Education Grade Specific | 3 | NA |
| General Psychology | 3 | NA |
| Religious Education | 3 | NA |
| General Biology | 0 | NA |
| Teacher Education Subject Specific | 0 | NA |
Online learning options are becoming more and more popular at American colleges and universities. Online classes are great for students who have busy schedules or for those who just want to study on their own time.
In 2022-2023, 254 students took at least one online class at Randall University. This is an increase from the 198 students who took online classes the previous year.
| Year | Took at Least One Online Class | Took All Classes Online |
|---|---|---|
| 2022-2023 | 254 | 90 |
| 2021-2022 | 198 | 100 |
| 2020-2021 | 209 | 122 |
| 2018-2019 | 154 | 111 |
Footnotes
*The racial-ethnic minorities count is calculated by taking the total number of students and subtracting white students, international students, and students whose race/ethnicity was unknown. This number is then divided by the total number of students at the school to obtain the racial-ethnic minorities percentage.
References
More about our data sources and methodologies.