Explore the best ranked schools for the programs you are most interested in.
Hocking Technical College landed the #1,606 spot in College Factual's 2025 ranking of best overall colleges in the United States. The higher ed experts analyzed 2,152 colleges and universities across the nation to determine this ranking. This is an improvement over the previous year, when Hocking Technical College held the #1,807 spot on the Best Overall Colleges list.
Hocking Technical College is also ranked #64 out of 91 schools in Ohio.
Since Hocking College has an open admissions policy, being accepted to the school isn't that hard. However, a full basic things - such as a high school diploma or equivalent - may be required. Also, go over your application to make sure it is complete before you submit it.
The student to faculty ratio at Hocking College is about average at 14 to 1. This ratio is often used to gauge how many students might be in an average class and how much time professors will have to spend with their students on an individual level. The national average for this metric is 15 to 1.
When estimating how much access students will have to their teachers, some people like to look at what percentage of faculty members are full time. This is because part-time teachers may not have as much time to spend on campus as their full-time counterparts.
The full-time faculty percentage at Hocking College is 39%. This is lower than the national average of 47%.
The freshmen retention rate is a measure of what percentage of first-year, full-time students come back for their sophomore year. The 46% rate at Hocking College is a good bit lower than the national rate of 68%. This could be for a number of reasons, such as students transferring after a year because they changed majors.
During the 2017-2018 academic year, there were 2,431 undergraduates at Hocking Technical College with 1,616 being full-time and 815 being part-time.
| $0-30 K | $30K-48K | $48-75 | $75-110K | $110K + |
|---|---|---|---|---|
| $10,569 | $10,971 | $13,325 | $15,526 | $15,527 |
The net price is calculated by adding tuition, room, board and other costs and subtracting financial aid.Note that the net price is typically less than the published for a school. For more information on the sticker price of Hocking Technical College, see our tuition and fees and room and board pages.
While almost two-thirds of students nationwide take out loans to pay for college, the percentage may be quite different for the school you plan on attending. At Hocking Technical College, approximately 63% of students took out student loans averaging $6,063 a year. That adds up to $24,252 over four years for those students.
Get more details about the location of Hocking College.
Contact details for Hocking Technical College are given below.
| Contact Details | |
|---|---|
| Address: | 3301 Hocking Parkway, Nelsonville, OH 45764 |
| Phone: | 740-753-3591 |
| Website: | www.hocking.edu/ |
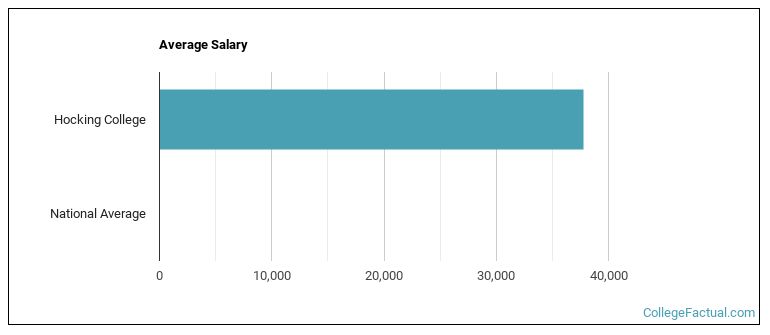
| Most Popular Majors | Bachelor’s Degrees | Average Salary of Graduates |
|---|---|---|
| Natural Resource Management | 53 | NA |
| Nursing | 51 | NA |
| Liberal Arts General Studies | 49 | NA |
| Criminal Justice & Corrections | 45 | NA |
| Ground Transportation | 34 | NA |
| Clinical/Medical Laboratory Science | 30 | NA |
| Wildlife Management | 25 | NA |
| Precision Metal Working | 25 | NA |
| Specialized Sales, Merchandising & Marketing | 19 | NA |
| Dental Support Services | 18 | NA |
Online courses area a great option for busy, working students as well as for those who have scheduling conflicts and want to study on their own time. As time goes by, expect to see more and more online learning options become available.
In 2022-2023, 1,037 students took at least one online class at Hocking College. This is an increase from the 1,026 students who took online classes the previous year.
| Year | Took at Least One Online Class | Took All Classes Online |
|---|---|---|
| 2022-2023 | 1,037 | 254 |
| 2021-2022 | 1,026 | 322 |
| 2020-2021 | 1,100 | 186 |
| 2018-2019 | 856 | 101 |
Footnotes
*The racial-ethnic minorities count is calculated by taking the total number of students and subtracting white students, international students, and students whose race/ethnicity was unknown. This number is then divided by the total number of students at the school to obtain the racial-ethnic minorities percentage.
References
More about our data sources and methodologies.