Hofstra total enrollment is approximately 10,444 students. 5,806 are undergraduates and 3,154 are graduate students.
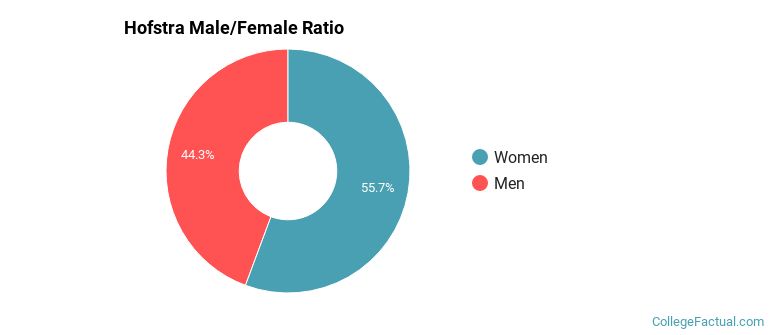
Male/Female Breakdown of Undergraduates
The full-time Hofstra undergraduate population is made up of 56% women, and 44% men.
For the gender breakdown for all students, go here.
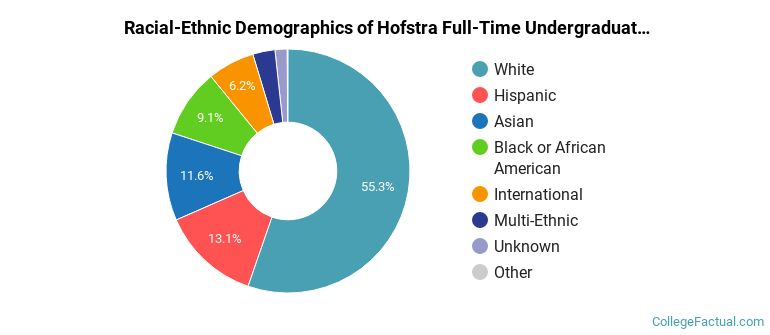
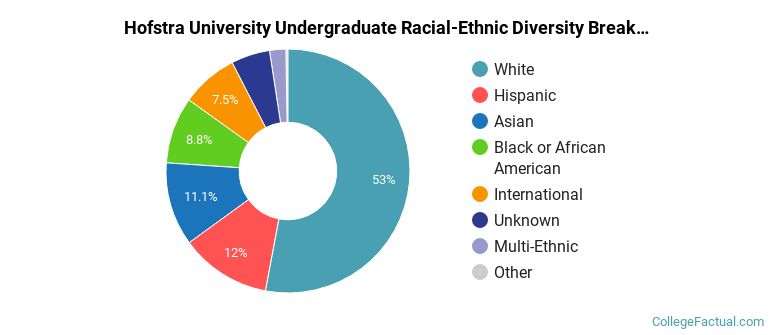
Hofstra Racial/Ethnic Breakdown of Undergraduates
| Race/Ethnicity | Number |
|---|---|
| White | 3,177 |
| Hispanic | 812 |
| Asian | 691 |
| Black or African American | 495 |
| International | 306 |
| Multi-Ethnic | 195 |
| Unknown | 110 |
| Native Hawaiian or Pacific Islander | 2 |
See racial/ethnic breakdown for all students.
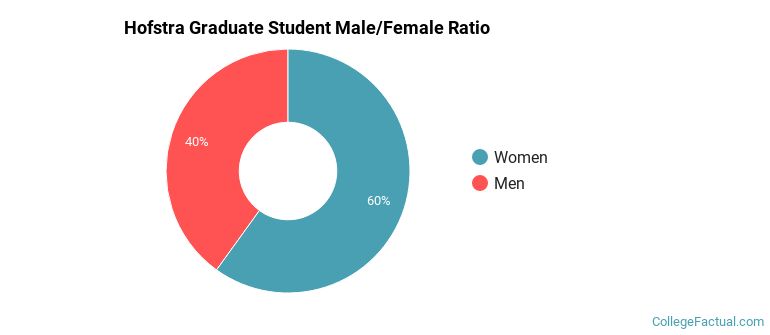
Male/Female Breakdown of Graduate Students
About 61% of full-time grad students are women, and 39% men.
For the gender breakdown for all students, go here.
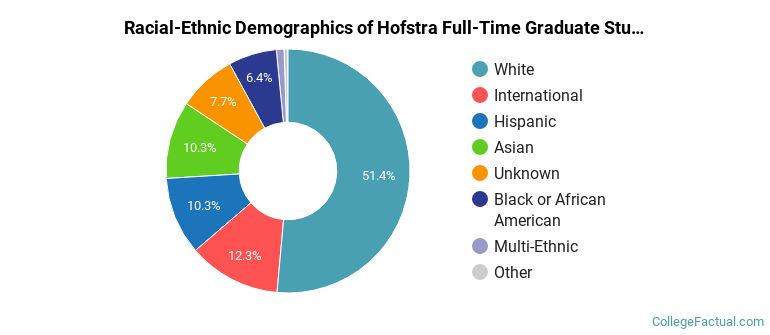
Hofstra Racial-Ethnic Breakdown of Graduate Students
| Race/Ethnicity | Number |
|---|---|
| White | 1,684 |
| Asian | 350 |
| Hispanic | 324 |
| International | 282 |
| Black or African American | 219 |
| Unknown | 208 |
| Multi-Ethnic | 68 |
| Native Hawaiian or Pacific Islander | 12 |
See racial/ethnic breakdown for all students.
| Race/Ethnicity | Number |
|---|---|
| White | 5,611 |
| Hispanic | 1,305 |
| Asian | 1,189 |
| Black or African American | 890 |
| International | 636 |
| Unknown | 470 |
| Multi-Ethnic | 290 |
| Native Hawaiian or Pacific Islander | 21 |

There are approximately 6,084 female students and 4,360 male students at Hofstra.
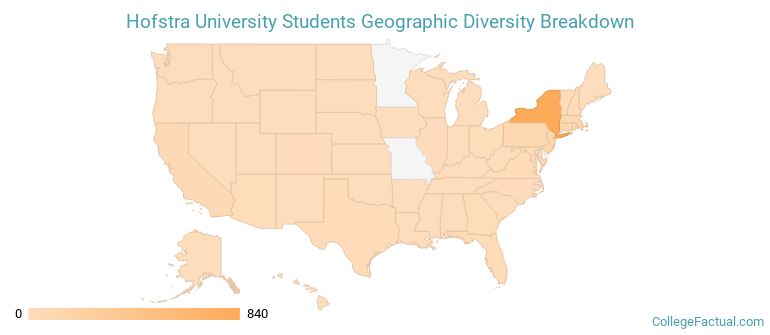
Hofstra ranks 404 out of 2,183 when it comes to geographic diversity.
45.4% of Hofstra students come from out of state, and 0% come from out of the country.
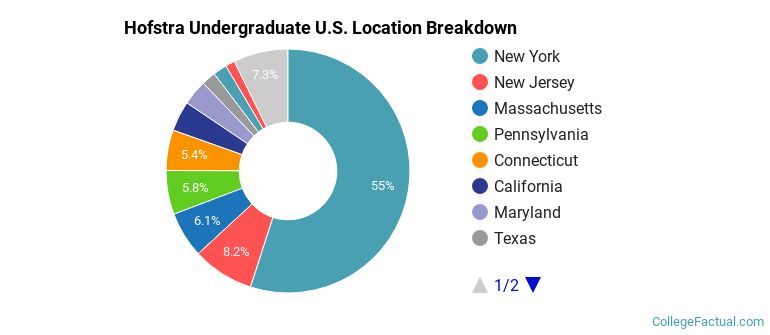
The undergraduate student body is split among 32 states (may include Washington D.C.). Click on the map for more detail.
| State | Amount |
|---|---|
| New York | 840 |
| New Jersey | 125 |
| Massachusetts | 93 |
| Pennsylvania | 89 |
| Connecticut | 82 |
Students from 87 countries are represented at this school, with the majority of the international students coming from China, India, and Canada.
Learn more about international students at Hofstra.
A traditional college student is defined as being between the ages of 18-21. At Hofstra, 51.91% of students fall into that category, compared to the national average of 60%.
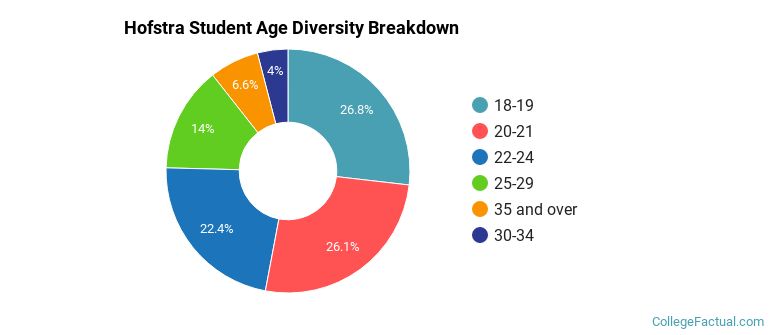
| Student Age Group | Amount |
|---|---|
| 18-19 | 2,927 |
| 20-21 | 2,851 |
| 22-24 | 2,448 |
| 25-29 | 1,525 |
| 35 and over | 716 |
| 30-34 | 441 |
| Under 18 | 0 |
Footnotes
*The racial-ethnic minorities count is calculated by taking the total number of students and subtracting white students, international students, and students whose race/ethnicity was unknown. This number is then divided by the total number of students at the school to obtain the racial-ethnic minorities percentage.
References
Department of Homeland Security Citizenship and Immigration Services
Read College Factual's Diversity Ranking Methodology.