HBU total enrollment is approximately 3,963 students. 2,146 are undergraduates and 184 are graduate students.
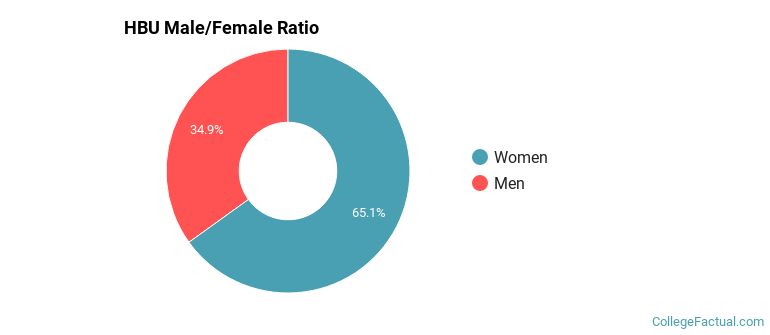
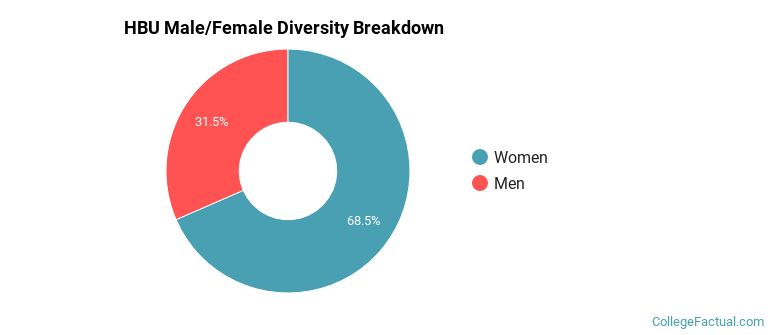
Male/Female Breakdown of Undergraduates
The full-time HBU undergraduate population is made up of 66% women, and 34% men.
For the gender breakdown for all students, go here.
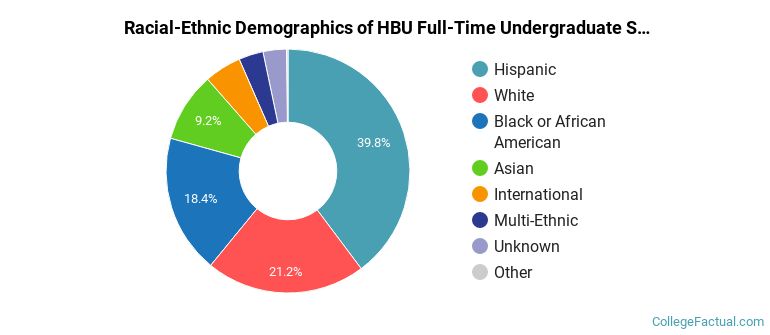
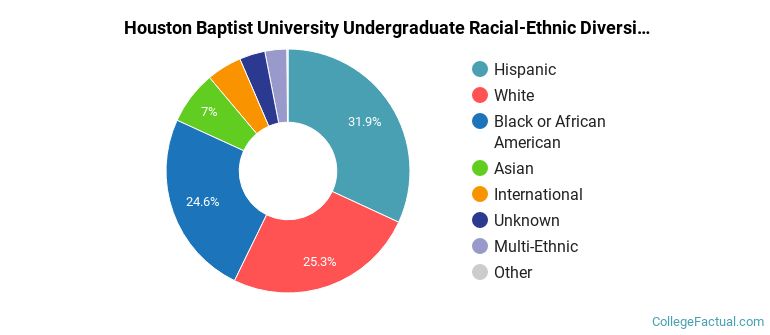
HBU Racial/Ethnic Breakdown of Undergraduates
| Race/Ethnicity | Number |
|---|---|
| Hispanic | 825 |
| White | 440 |
| Black or African American | 392 |
| Asian | 216 |
| International | 114 |
| Multi-Ethnic | 88 |
| Unknown | 57 |
| Native Hawaiian or Pacific Islander | 5 |
See racial/ethnic breakdown for all students.
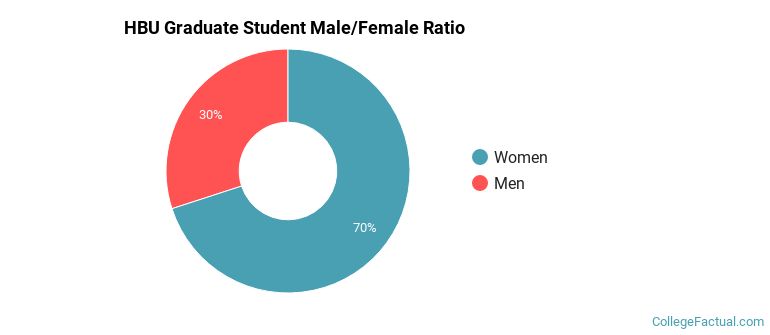
Male/Female Breakdown of Graduate Students
About 78% of full-time grad students are women, and 22% men.
For the gender breakdown for all students, go here.
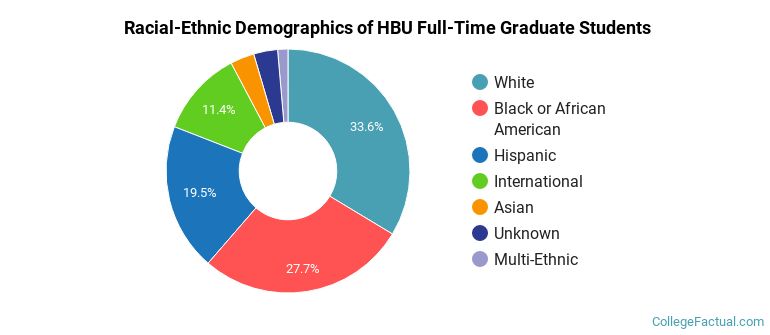
HBU Racial-Ethnic Breakdown of Graduate Students
| Race/Ethnicity | Number |
|---|---|
| Black or African American | 67 |
| White | 54 |
| Hispanic | 36 |
| International | 15 |
| Asian | 7 |
| Unknown | 3 |
| Multi-Ethnic | 2 |
| Native Hawaiian or Pacific Islander | 0 |
See racial/ethnic breakdown for all students.
| Race/Ethnicity | Number |
|---|---|
| Hispanic | 1,257 |
| Black or African American | 1,029 |
| White | 945 |
| Asian | 282 |
| International | 195 |
| Multi-Ethnic | 124 |
| Unknown | 116 |
| Native Hawaiian or Pacific Islander | 6 |
There are approximately 2,752 female students and 1,211 male students at HBU.
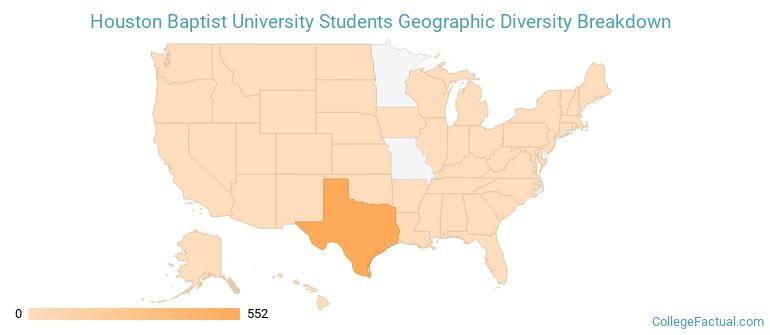
HBU ranks 1,695 out of 2,183 when it comes to geographic diversity.
3.12% of HBU students come from out of state, and 0% come from out of the country.
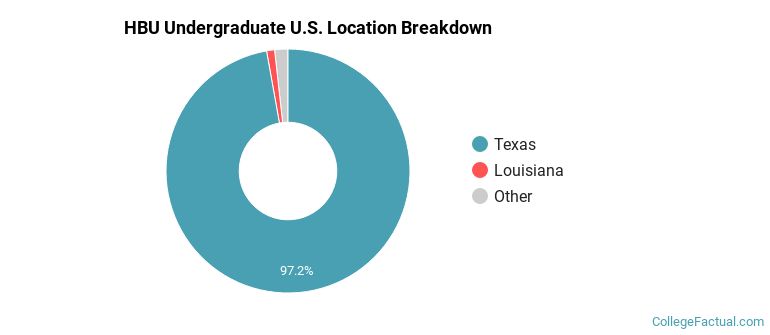
The undergraduate student body is split among 10 states (may include Washington D.C.). Click on the map for more detail.
| State | Amount |
|---|---|
| Texas | 552 |
| Louisiana | 6 |
| Illinois | 2 |
| Oklahoma | 2 |
| California | 1 |
Students from 51 countries are represented at this school, with the majority of the international students coming from Nigeria, China, and India.
Learn more about international students at HBU.
A traditional college student is defined as being between the ages of 18-21. At HBU, 49.95% of students fall into that category, compared to the national average of 60%.
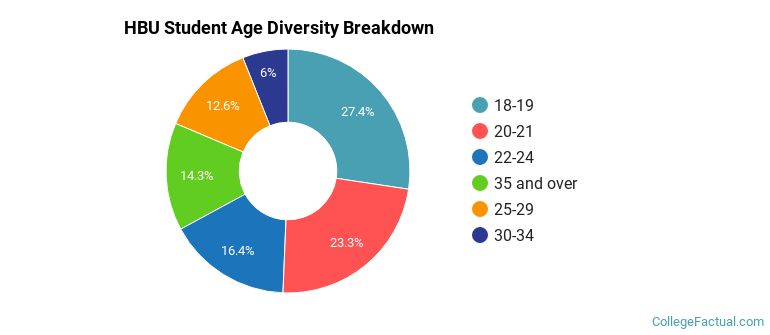
| Student Age Group | Amount |
|---|---|
| 18-19 | 898 |
| 20-21 | 763 |
| 22-24 | 539 |
| 35 and over | 468 |
| 25-29 | 413 |
| 30-34 | 198 |
| Under 18 | 0 |
Footnotes
*The racial-ethnic minorities count is calculated by taking the total number of students and subtracting white students, international students, and students whose race/ethnicity was unknown. This number is then divided by the total number of students at the school to obtain the racial-ethnic minorities percentage.
References
Department of Homeland Security Citizenship and Immigration Services
Image Credit: By LUSportsFan under License
Learn more about how College Factual creates their Diversity Rankings.