Illinois State total enrollment is approximately 20,720 students. 16,666 are undergraduates and 1,377 are graduate students.
Male/Female Breakdown of Undergraduates
The full-time Illinois State undergraduate population is made up of 57% women, and 43% men.

For the gender breakdown for all students, go here.
Illinois State Racial/Ethnic Breakdown of Undergraduates

| Race/Ethnicity | Number |
|---|---|
| White | 11,877 |
| Hispanic | 1,988 |
| Black or African American | 1,623 |
| Multi-Ethnic | 589 |
| Asian | 403 |
| International | 121 |
| Unknown | 35 |
| Native Hawaiian or Pacific Islander | 12 |
See racial/ethnic breakdown for all students.
Male/Female Breakdown of Graduate Students
About 59% of full-time grad students are women, and 41% men.

For the gender breakdown for all students, go here.
Illinois State Racial-Ethnic Breakdown of Graduate Students

| Race/Ethnicity | Number |
|---|---|
| White | 746 |
| International | 364 |
| Hispanic | 91 |
| Black or African American | 63 |
| Unknown | 43 |
| Multi-Ethnic | 37 |
| Asian | 31 |
| Native Hawaiian or Pacific Islander | 1 |
See racial/ethnic breakdown for all students.

| Race/Ethnicity | Number |
|---|---|
| White | 14,560 |
| Hispanic | 2,300 |
| Black or African American | 1,968 |
| Multi-Ethnic | 683 |
| International | 547 |
| Asian | 507 |
| Unknown | 120 |
| Native Hawaiian or Pacific Islander | 14 |

There are approximately 11,965 female students and 8,755 male students at Illinois State.
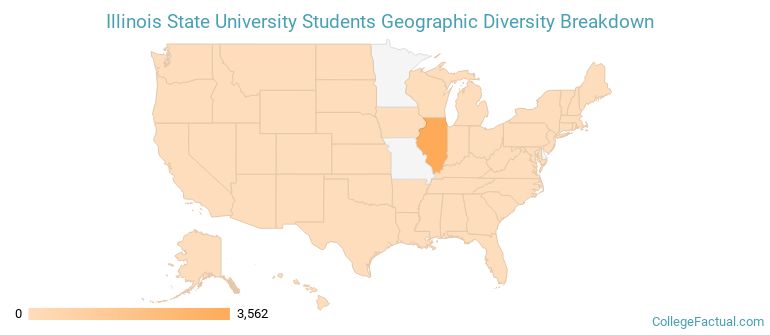
Illinois State ranks 1,511 out of 2,183 when it comes to geographic diversity.
3.21% of Illinois State students come from out of state, and 0.38% come from out of the country.

The undergraduate student body is split among 23 states (may include Washington D.C.). Click on the map for more detail.
| State | Amount |
|---|---|
| Illinois | 3,562 |
| Wisconsin | 24 |
| Indiana | 17 |
| Texas | 9 |
| Iowa | 8 |
Students from 72 countries are represented at this school, with the majority of the international students coming from India, Panama, and China.
Learn more about international students at Illinois State.
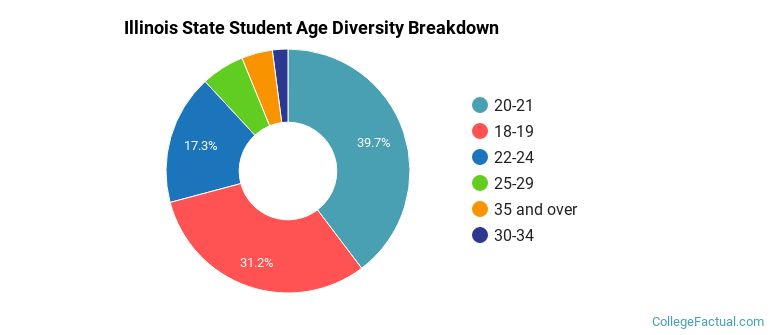
A traditional college student is defined as being between the ages of 18-21. At Illinois State, 70.61% of students fall into that category, compared to the national average of 60%.
| Student Age Group | Amount |
|---|---|
| 20-21 | 8,219 |
| 18-19 | 6,456 |
| 22-24 | 3,574 |
| 25-29 | 1,187 |
| 35 and over | 851 |
| 30-34 | 426 |
| Under 18 | 0 |
Footnotes
*The racial-ethnic minorities count is calculated by taking the total number of students and subtracting white students, international students, and students whose race/ethnicity was unknown. This number is then divided by the total number of students at the school to obtain the racial-ethnic minorities percentage.
References