We’ve pulled together the essential facts you should know about the program at Institute of American Indian Arts. You can study it at the Bachelor’s, Associate’s levels, with graduate study also available. It ranks as high as #1 out of 3 schools (Bachelor’s level) by College Factual. Jump to any of the following sections:
By College Factual’s measure, Institute of American Indian Arts among the top schools in the country for fine & studio arts, coming in at #461 out of 664 schools nationally.
| Ranking | Rank |
|---|---|
| Best Fine & Studio Arts Schools | 461 of 664 |
| Best Fine & Studio Arts Schools in New Mexico | 1 of 5 |
| Best Fine & Studio Arts Schools in the Southwest Region | 36 of 59 |
The following degree levels are offered in fine & studio arts at Institute of American Indian Arts, along with how many graduates complete each level annually.
| Degree Level | Annual Graduates |
|---|---|
| Bachelor’s | 10 |
| Associate’s | 2 |
| Master’s | 8 |
For the most recent IPEDS reporting year, Institute of American Indian and Alaska Native Culture and Arts Development handed out 10 bachelor’s degrees in fine & studio arts.
Institute of American Indian Arts is among the very best schools in the country for fine & studio arts at the bachelor’s level. Specifically, it ranked #1 out of 3 schools by College Factual.
Average full-time tuition and fees are listed in the table below.
| In State | Out of State | |
|---|---|---|
| Tuition | $4,686 | $5,320 |
| Fees | $600 | $600 |
Read more about Institute of American Indian Arts tuition and fees.
Among recent graduates, 50% of fine & studio arts bachelor’s degrees went to men and 50% went to women.
 The majority of fine & studio arts bachelor’s degree graduates at Institute of American Indian Arts are Hispanic or Latino. About 20% of graduates fell into this category.
The following table and chart show the ethnic background for students who recently graduated from Institute of American Indian and Alaska Native Culture and Arts Development with a bachelor’s in fine & studio arts.
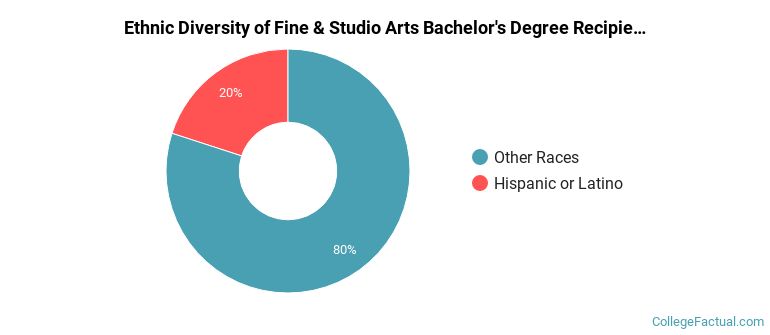
| Ethnic Background | Number of Students |
|---|---|
| Asian | 0 |
| Black or African American | 0 |
| Hispanic or Latino | 2 |
| White | 0 |
| Non-Resident Aliens | 0 |
| Other Races | 8 |
Institute of American Indian Arts conferred 10 bachelor’s degrees in fine/studio arts, general in the most recent reporting year — 50% to women and 50% to men. The largest share of these graduates were Hispanic or Latino (20%).
During the most recent reporting year, Institute of American Indian and Alaska Native Culture and Arts Development handed out 2 associate’s degrees in fine & studio arts.
Institute of American Indian Arts is not yet ranked for fine & studio arts at the associate’s level.
Among recent graduates, 50% of fine & studio arts associate’s degrees went to men and 50% went to women.

The following table and chart show the ethnic background for students who recently graduated from Institute of American Indian and Alaska Native Culture and Arts Development with a associate’s in fine & studio arts.
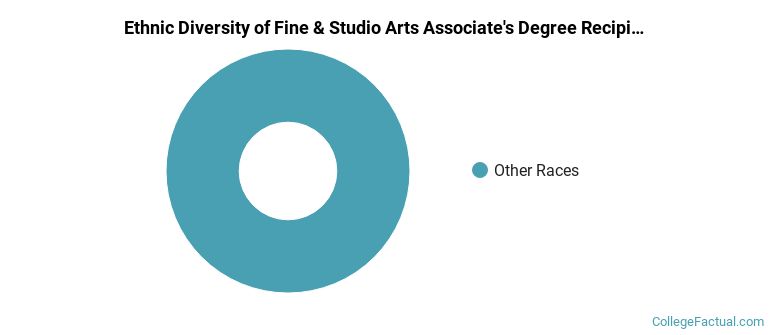
| Ethnic Background | Number of Students |
|---|---|
| Asian | 0 |
| Black or African American | 0 |
| Hispanic or Latino | 0 |
| White | 0 |
| Non-Resident Aliens | 0 |
| Other Races | 2 |
Institute of American Indian Arts awarded 2 associate’s completions in fine/studio arts, general in the most recent reporting year — 50% to women and 50% to men.
Graduate study is also available at Institute of American Indian Arts. Here are the graduate award levels offered.
| Graduate Level | Annual Graduates |
|---|---|
| Master’s Degrees in Fine & Studio Arts | 8 |